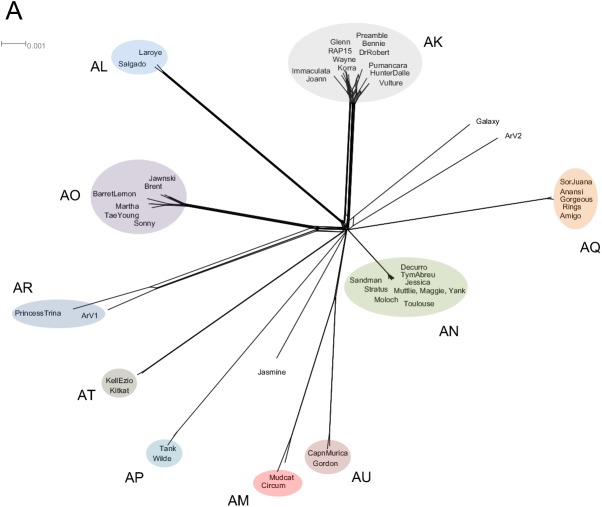
Fig 3. Splitstree representation of Arthrobacter phages and average nucleotide comparisons of Cluster AO Arthrobacter phages.
All Arthrobacter phage predicted proteins were assorted into 1052 phams according to shared amino acid sequence similarities. Each genome was then assigned a value reflecting the presence or absence of a pham member, and the genomes were compared and displayed using Splitstree [36]. Cluster and subcluster assignments derived from the dot plot and ANI analyses are annotated. The scale bar indicates 0.001 substitutions/site.

