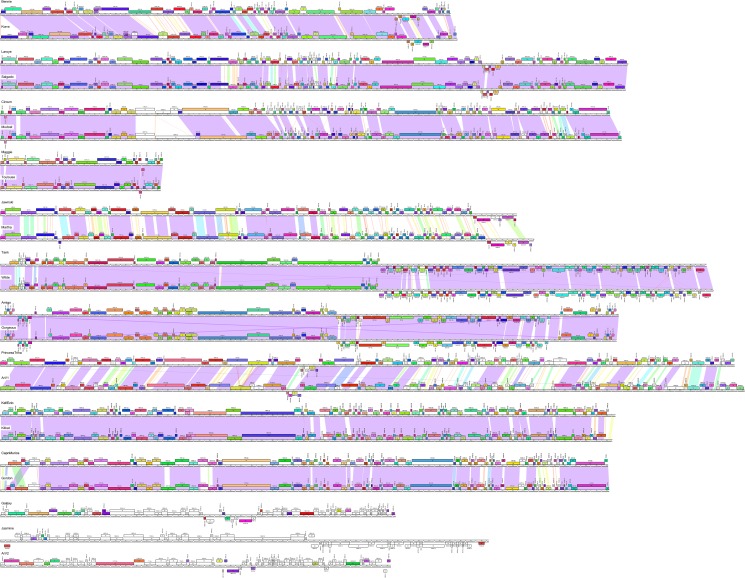
Fig 4. Pairwise alignment of clustered Arthrobacter phages.
The genomes of 23 Arthrobacter phages are shown. Pairwise nucleotide sequence similarity is displayed by color-spectrum coloring between the genomes, with violet as most similar and red as least similar. Genes are shown as boxes above (transcribed rightwards) and below (transcribed leftwards) each genome line; boxes are colored according to the gene phamilies they are assigned [29]. Maps were generated using Phamerator and its database Actinobacteriophage_692.

