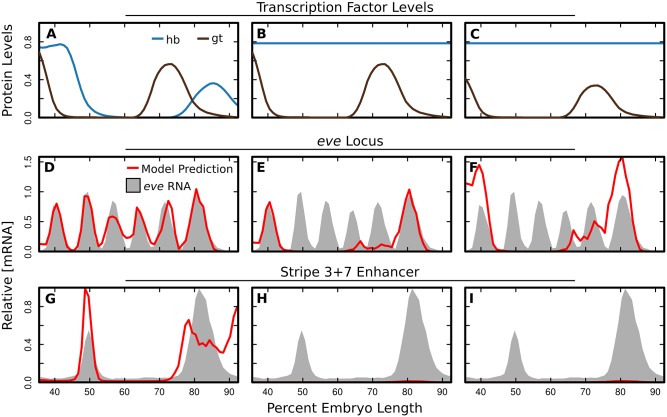
Fig 6. Predicted effects of ectopic Hb.
A: The measured relative levels of Hb and Gt (y-axis) from 35.5% to 92.5% embryo length (x-axis) [30–33]. B: Simulated relative levels of Hb and Gt. Hb is set to a spatially uniform value and Gt is unchanged from A. C: Simulated relative levels of Hb and Gt. Hb is set to a spatially uniform value and Gt is reduced by 40%. D-F: Predicted relative [mRNA] levels (red lines) driven by the eve locus under the TF levels indicated in A-C. Model output is standardized to the maximum rate driven by the locus in the wildtype trans environment. Data for relative [mRNA] of eve (gray shading) is included for visual orientation within the embryo and levels are not commensurate with predicted locus output. G-H: Predicted relative [mRNA] levels (red lines) driven by the eve Stripe 3+7 enhancer under the TF levels indicated in A-C. Model output is standardized to the maximum rate driven by the enhancer in the wildtype trans environment. Data for relative [mRNA] driven by the stripe 3+7 enhancer (gray shading) is included for visual orientation within the embryo and levels are not commensurate with predicted enhancer output.

