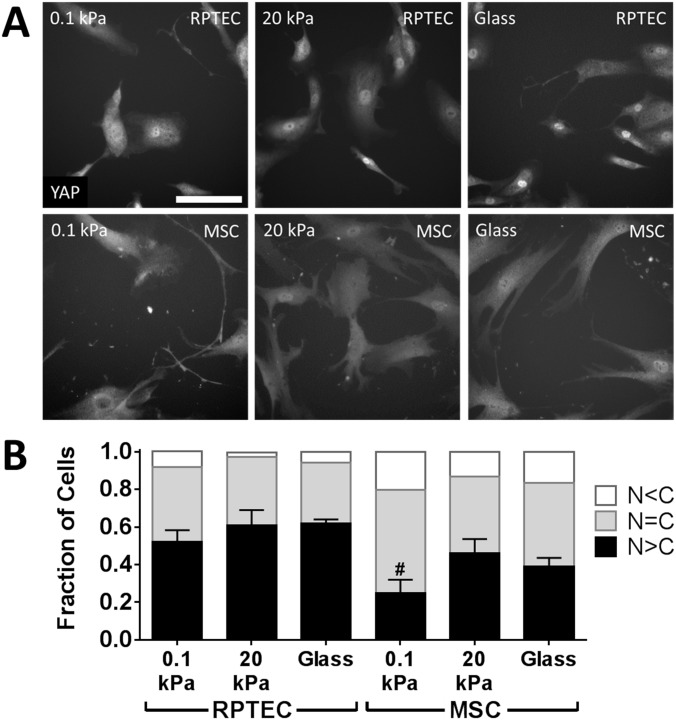
Fig 5. Matrix stiffness modestly affects YAP nuclear localization.
(A) RPTECs were allowed to attach to substrates for 24 h, then were fixed and stained for YAP. All cells in each of 9 images per condition per experiment were categorized as having stronger (N>C), similar (N = C), or weaker (N<C) YAP staining in the nucleus than the cytoplasm. Mesenchymal stem cells (MSCs), which have a well-described alteration in YAP nuclear localization with substrate stiffness, were used as a control. Images with distributions most closely matching the overall mean are shown. (B) distributions of YAP localization for RPTECs and MSCs. χ2 contingency table analysis for RPTECs or MSCs (analyzed separately) yields a distribution dependence on substrate with p = 0.006 and p = 0.0005, respectively. Treating the fraction of cells with N>C as a continuous variable with ANOVA and Tukey’s post-hoc test shows only a difference between MSCs on 0.1 kPa vs 20 kPa gels (#, p < 0.05). Scale bar: 100 μm (applies to all images).

