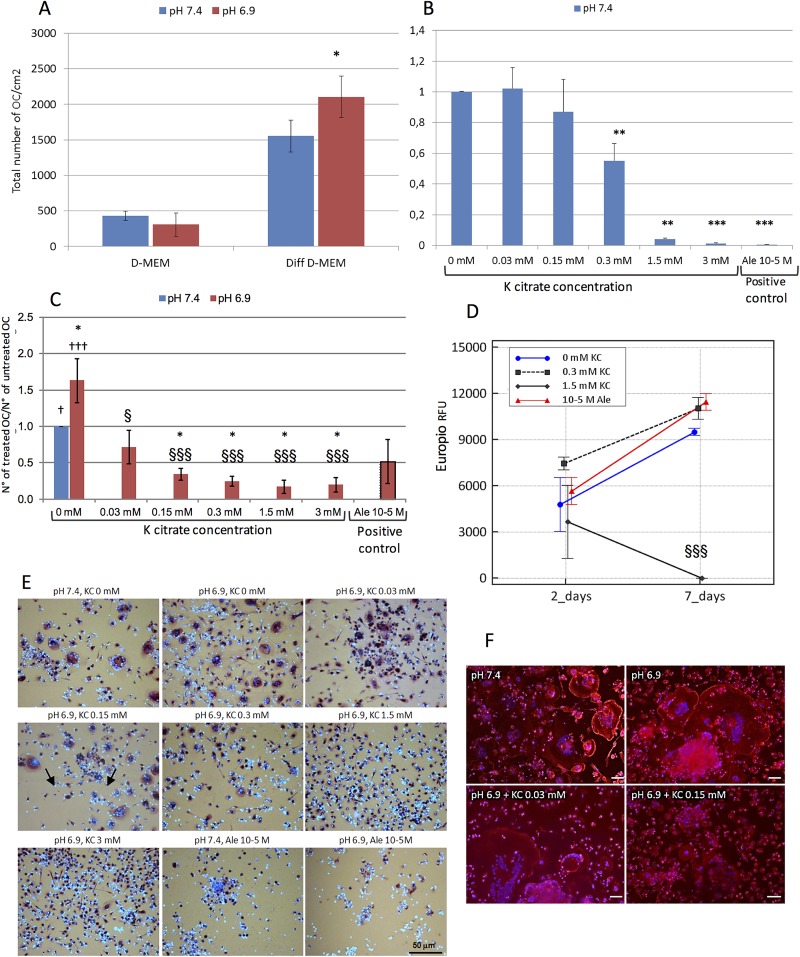
Fig 2.
A) Effect of the acidic microenvironment on OC differentiation. Data are expressed as total number of OC/cm2. The bars represent the mean ± SEM of seven experiments performed at pH 7.4 and pH 6.9, B) K citrate inhibits the OC differentiation induced at pH 7.4. Results are expressed as a ratio between number of OC counted in cultures treated at pH 7.4 with different K citrate concentrations and number of OC counted in the negative control (pH 7.4, K citrate 0 mM, ratio = 1). Positive control is Alendronate 10−5 M. Mean ± SEM of four experiments. C) K citrate inhibits the OC differentiation induced by acidic microenvironment. Results are expressed as a ratio between number of OC counted in cultures treated at pH 6.9 with different K citrate concentrations and number of OC counted in the negative control (pH 7.4, K citrate 0 mM, ratio = 1). Mean ± SEM of six experiments. D) K citrate hampers the collagen degradation due to the activity of mature OC in acidic microenvironment. Results are expressed as mean ± SEM of RFU values of Europium-labeled collagen fragments in cultures of mature OC maintained at pH 6.9 (negative control) or treated with K citrate (KC). The experiment was repeated with cells obtained from two donors, with four replicates for each condition. E) OC are the cells with more than three nuclei (nuclear dye Hoechst 33258, blue) and a positive reaction for TRAP in the cytoplasm (red staining). The arrows indicate small and large OC. Magnification x 20, Scale bar = 50 μm. F) The phalloidin staining (TRITC, red) shows the typical dense belt-like structure of actin ring in multinucleated giant cells (blue nuclear-dye) cultured at pH 7.4 and pH 6.9; the ring microarchitecture is weakened after supplementation with K citrate 0.03 mM and no more recognizable with K citrate 1.5 mM. Magnification x 20, Scale bar = 50 μm. Symbols in histograms indicate statistically significant differences vs pH 7.4 negative control (*), vs Ale 10−5 M positive control (†), and vs K citrate 0 mM, pH 6.9 (§). P values ≤ 0.05, ≤ 0.01 and ≤ 0.001 were highlighted by one, two or three symbols, respectively.

