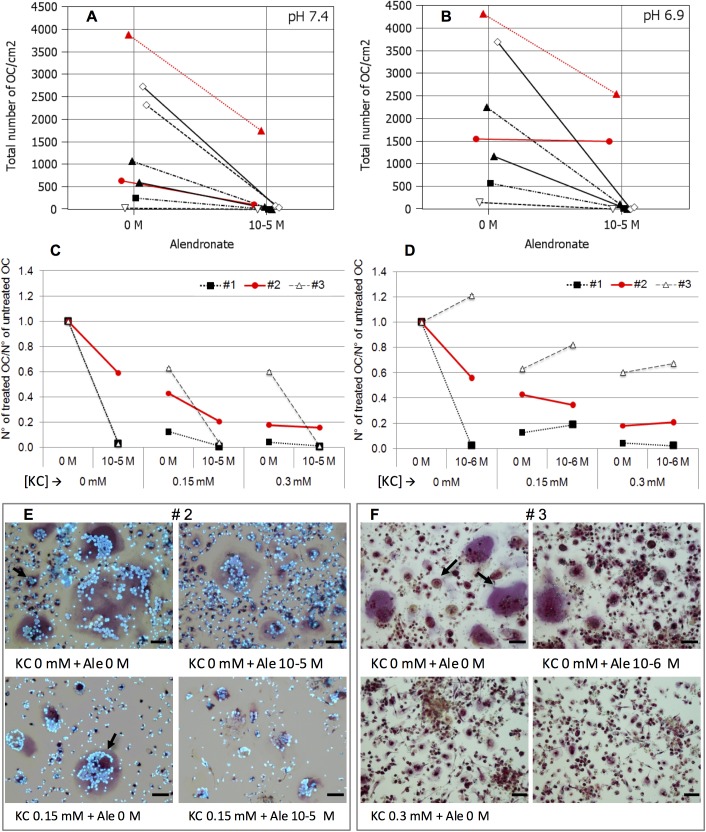
Fig 5. Effect of K citrate on OC cultures resistant to alendronate under the effect of acidic microenvironment.
Data are expressed as total number of OC counted in eight separate experiments. The OC cultures react differently to the alendronate in neutral (A) or acidic (B) culture medium. The red lines highlight two cultures which were resistant to the anti-osteoclastogenic effect of Ale 10−5. The C and D graphs show the data of three separate experiments (#1; #2; #3) exposed to Ale 10−5 (C) and Ale 10−6 (D), supplemented with K citrate (0 mM, 0.15 mM, 0.3 mM). Results are expressed as a ratio between number of OC treated with different concentrations of K citrate/ alendronate, and number of OC counted in the negative control, i.e. K citrate 0 mM, Ale 0 mM, pH 6.9. The red line is the OC culture resistant to Ale 10−5 (#2), and representative images are shown in the panel E. The dashed line is the OC culture which is stimulated by Ale 10−6 (#3), and the pictures below highlight the effect of K citrate (F). OC are the cells with more than three nuclei and red staining of cytoplasm (positive reaction to TRAP). The arrows indicate small and large OC. KC is K citrate. Magnification x 20, Scale bar = 50 μm.

