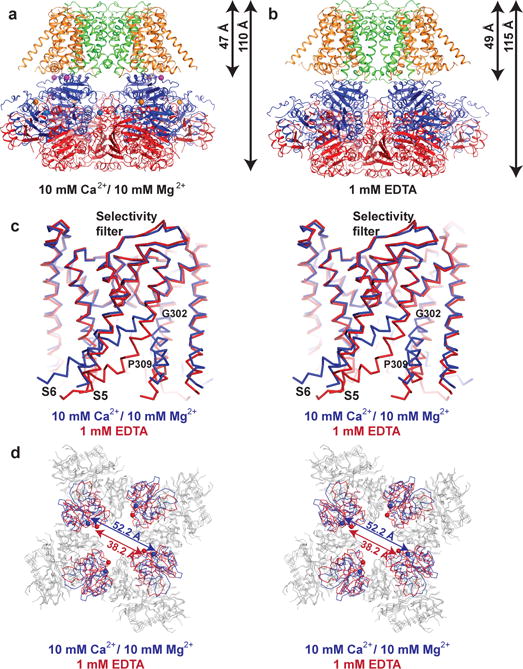
Figure 1. Comparison of Ca2+-bound and EDTA Slo1 structures.

a, b, Ribbon diagrams of Ca2+-bound (a) and EDTA (b) Slo1 with individual domains colored uniquely (orange, VSD; green, pore domain; blue, RCK1; red, RCK2). c, Superposition of the Slo1 pore domain in the Ca2+-bound (blue) and EDTA (red) states aligned by their pore helices and selectivity filters. d, Superposition of the Slo1 gating rings in the Ca2+-bound (blue) and EDTA (red) states aligned by their RCK2 domains (grey). The spheres represent the locations of the Cα atom of K320.
