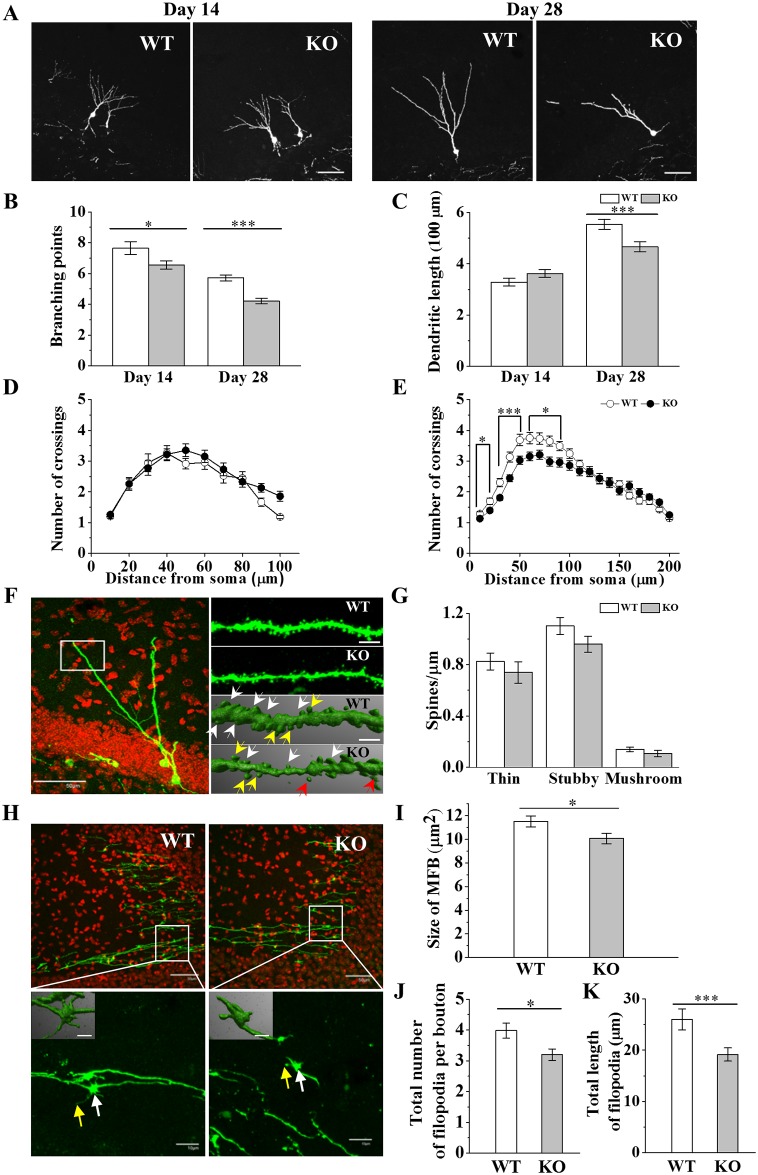
Fig 3. Effects of Cav1.3 KO on developments of dendrites, spines and MFB filopodia of DG newborn neurons.
(A) Confocal images of GFP (+) neurons at 14 and 28 days after GFP-retroviral infection. Scale bar, 50 μm. (B-E) Quantification of dendritic development. *, **, *** indicate p < 0.05, p < 0.01, p < 0.001, respectively. (B) Total number of dendritic branching points at 14 and 28 days after viral infection. (Day 14, WT, 7.64 ± 0.41, n = 62, KO, 6.55 ± 0.25, n = 102, p = 0.017; Day 28, WT, 5.71 ± 0.20, n = 107, KO, 4.20 ± 0.18, n = 120, p < 0.00001, n = 3 animals per group). Two-way ANOVA, FG = 26.96, p = 0.000; FT = 73.08, p = 0.000; FG+T = 0.68, p = 0.001. (C) Total dendritic length measurement at 14 and 28 days after viral injection. (Day 14, WT, 328.35 ± 14.57 μm, n = 69, KO, 362.34 ± 45.06 μm, n = 100, p = 0.12; Day 28, WT, 552.90 ± 19.15 μm, n = 107, KO, 466.34 ± 19.97 μm, n = 119, n = 4 animals per group, p = 0.002). Two-way ANOVA, FG = 1.96, p = 0.162; FT = 76.56, p = 0.000; FG+T = 10.31, p = 0.001. (D-E) Number of dendritic crossings in Sholl analysis at 14 (D) and 28 days (E) after viral infection. (Day 28: 10 μm, WT, 1.29 ± 0.07, KO, 1.13 ± 0.04, p = 0.022; 20 μm, WT, 1.70 ± 0.10, KO, 1.39 ± 0.07, p = 0.011; 30 μm, WT, 2.30 ± 0.13, KO, 1.81 ± 0.09, p = 0.001; 40 μm, WT, 3.13 ± 0.16, KO, 2.44 ± 0.11, p = 0.001; 50 μm, WT, 3.69 ± 0.18, KO, 3.03 ± 0.13, p = 0.004; 60 μm, WT, 3.75 ± 0.18, KO, 3.15 ± 0.14, p = 0.010; 70 μm, WT, 3.73 ± 0.19, KO, 3.21 ± 0.15, p = 0.025; 80 μm, WT, 3.65 ± 0.16, KO, 2.98 ± 0.14, p = 0.005; 90 μm, WT, 3.49 ± 0.15, KO, 2.96 ± 0.15, p = 0.013; WT, n = 107 cells, KO, n = 122 cells, n = 4 animals per group). Two-way ANOVA, FG = 10.54, p = 0.001; FT = 27.18, p = 0.000; FD = 92.87, p = 0.000; FG+T = 34.97, p = 0.000; FG+D = 1.23, p = 0.27; FT+D = 23.76, p = 0.000; FG+T+D = 0.92, p = 0.504. (F) Left, representative image (60x) of newborn neurons at 28 days after GFP-retroviral infection. Red, DAPI. White rectangle shows a distal dendritic region of a newborn neuron of Cav1.3 WT mice for spine analysis. Right, exemplary high magnification (60x/6x-zoom) images (top) and 3D reconstruction images (bottom) of a distal dendritic region of a newborn neuron of WT and Cav1.3 KO mice. White arrows indicate stubby spines, yellow arrows indicate mushroom spines and red arrows indicate thin spines. Scale bar, 50 μm (60x), 5 μm (60x/6x-zoom) and 2 μm (3D image). (G) Spine density plot for each type of spines. (Thin spines, WT, 0.82 ± 0.07 spines/μm, KO, 0.83 ± 0.06 spines/μm, p = 0.434; stubby spines, WT, 1.10 ± 0.07 spines/μm, KO, 0.95 ± 0.05 spines/μm, p = 0.064; mushroom spines, WT, 0.14 ± 0.017 spines/μm, KO, 0.20 ± 0.06 spines/μm, p = 0.409, WT, n = 28 cells, KO, n = 29 cells, n = 2 animals per group). (H) Top, confocal images of CA3 region axonal fibers of newborn neurons at 28 days after GFP expressing retrovirus injection. Red, DAPI. Bottom, high magnification images of axonal boutons near CA3 pyramidal cell layer. White and yellow arrows indicate boutons and filopodia, respectively. Insets, 3D image of bouton and filopodia. Scale bars, 50 μm (40x), 10 μm (40x/6x-zoom), 5 μm (insets). (I) Size of mossy fiber boutons (WT, 11.52 ± 0.47, n = 84 boutons; KO, 10.07 ± 0.45, n = 70 boutons, n = 3 animals per group, p = 0.029). (J) Total number of filopodia of axonal boutons (WT, 3.98 ± 0.25, n = 53 boutons, KO, 3.2 ± 0.19, n = 65 boutons, n = 3 animals per group, p = 0.010) and (K) the length of filopodia of axonal boutons (WT, 25.99 ± 2.02 μm, n = 53 boutons, KO, 19.16 ± 1.29 μm, n = 65 boutons, n = 3 animals per group, p = 0.004).

