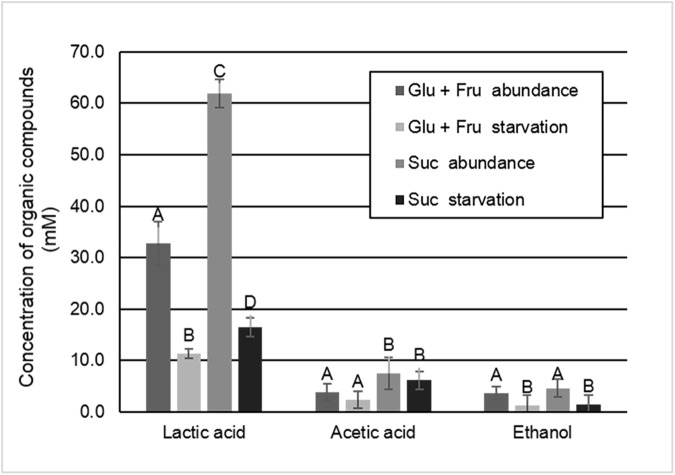
Fig 4. Concentration of organic compounds (mM) in the culture medium according to the biofilm treatments (glucose + fructose or sucrose) and the harvest moment (abundance or starvation).
Distinct capital letters indicate significant statistically differences among groups for each type organic compound (p < 0.05). (Mean ± SD; n = 6).

