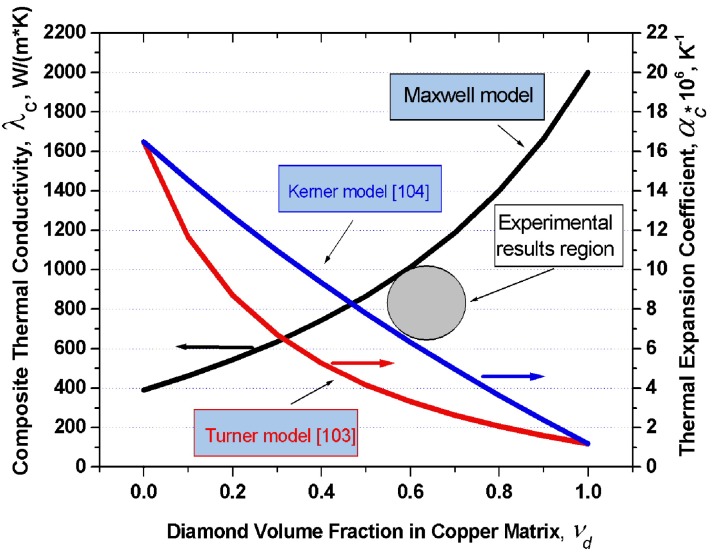
Figure 4.
Graphs of the thermal conductivity in the diamond-copper system calculated in 16 the frame of the Maxwell model, and of the thermal expansion coefficient in terms of the 17 models of Turner and Kerner, plotted vs. composite composition. Grey circle indicates experimental values of the thermal conductivity and thermal expansion coefficient from [102].

