
Figure 3. ALDH2 acetylation results in mixed inhibition.
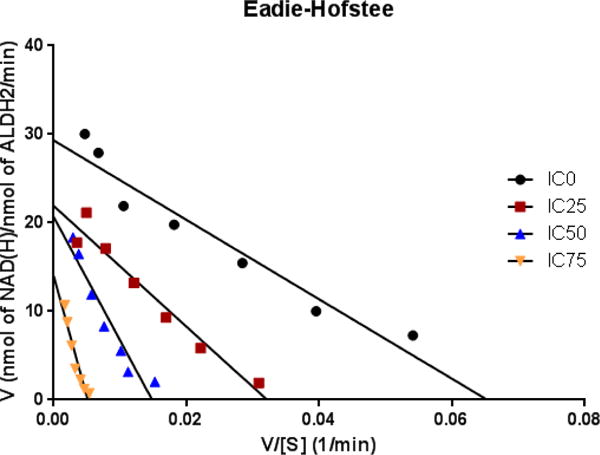
An Eadie-Hofstee plot of ALDH2 activity following untreated (IC0) or IC25, IC50 or IC75 concentrations of acetic anhydride further characterizes the acetylation-induced inhibition of ALDH2. The shift in both the slope of the lines (-Km) as well as the kcat values listed in Table 2 suggests that acetylation acts in a mixed inhibitory fashion.