. 2017 Jun 15;6:e22861. doi: 10.7554/eLife.22861

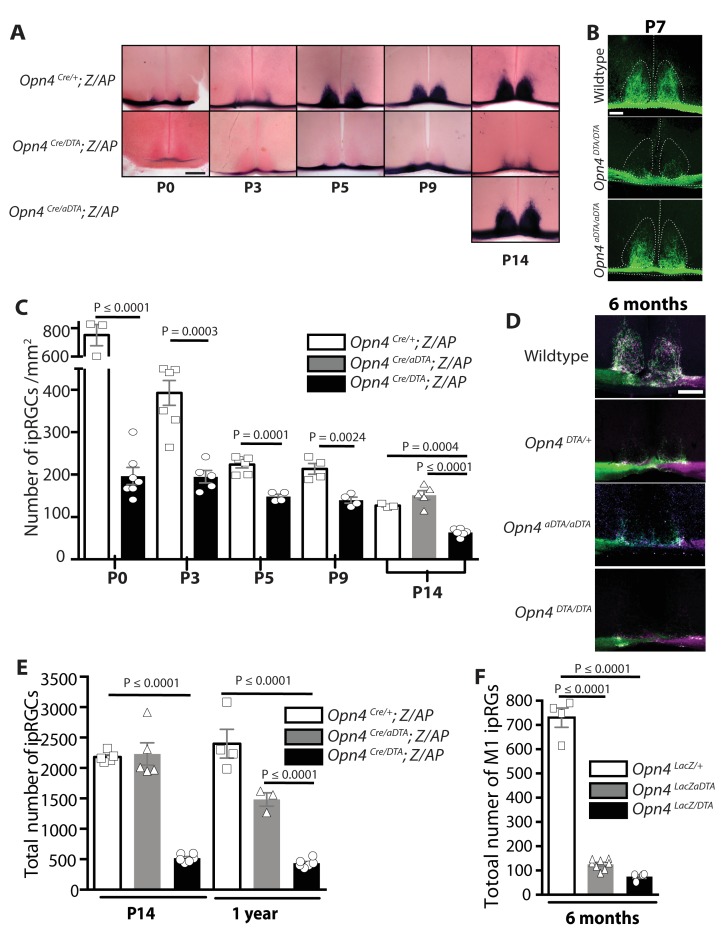
Figure 1. Developmental ablation of ipRGCs in the mouse retina.

(A) Developmental time course of ipRGC innervation of the SCN, visualized by AP staining, in Opn4Cre/+; Z/AP and Opn4Cre/DTA; Z/AP mouse. For comparison, SCN staining from Opn4Cre/aDTA; Z/AP mice at P14 are also shown. Scale bar = 200 μm. (B) SCN innervation in P7 WT, Opn4DTA/DTA, and Opn4aDTA/aDTA mice revealed by CTB injections into the eyes. Scale bar = 100 μm. (C) Developmental time course of ipRGC (all subtypes) cell density visualized by AP staining of retina from Opn4Cre/+ Z/AP (control) and Opn4Cre/DTA; Z/AP mice at P0 (control n = 3, DTA n = 7), P3 (control n = 7, DTA n = 5), P5 (control n = 6, DTA n = 4), P9 (control n = 4, DTA n = 4), and P14 (control n = 3, DTA n = 6, aDTA n = 5). Cell counts from P14 retinas of Opn4Cre/aDTA; Z/AP mice are also shown for comparison. Using a two-way ANOVA, we found a strongly significant effect of genotype. A t-test for P0, P3, P5, and P9 time points, and a one-way ANOVA with Bonferroni's post-hoc analysis for P14 revealed a significant cell loss at each time point. (D) SCN innervation revealed by CTB injections into the eyes of 6-month-old WT, Opn4DTA/+, Opn4DTA/DTA, and Opn4aDTA/aDTA mice. Scale bar = 200 μm. (E) Total cell counts of ipRGCs (all subtypes) revealed by alkaline phosphatase staining at P14 and 1 year of age in Opn4Cre/+; Z/AP (control; P14: n = 5, 1 year: n = 4), Opn4Cre/aDTA; Z/AP (P14: n = 5; 1 year: n = 3), and Opn4Cre/DTA; Z/AP (P14: n = 6; 1 year: n = 6). Two-way ANOVA, Bonferroni's multiple comparisons test and adjusted p values. (F) Total cell counts of M1 ipRGCs, identified by x-Gal staining of retinas from 6 month old Opn4LacZ/+ (control; n = 4), Opn4LacZ/aDTA, and Opn4LacZ/DTA mice (n = 4). One-way ANOVA, Bonferroni's multiple comparisons test and adjusted p values. Error bars represent s.e.m. for all graphs. See also Figure 1—figure supplement 1.

DOI: http://dx.doi.org/10.7554/eLife.22861.002

Figure 1.

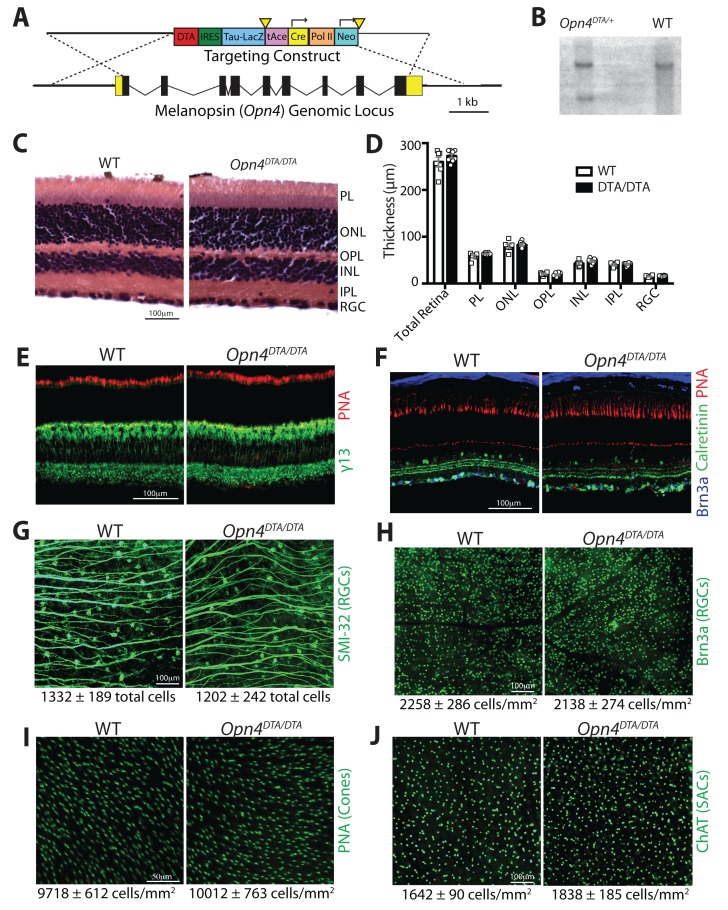
Figure 1—figure supplement 1. Generation and characterization of mice with an Opn4DTA allele.

Figure 1—figure supplement 1.

(A) Targeting construct for inserting the coding sequence of DTA into the melanopsin (Opn4) locus. (B) Southern blot analysis confirming homologous recombination of the targeting construct at Opn4 locus in ES cells. (C) Hematoxylin and eosin staining on retinal sections from WT and Opn4DTA/DTA mice. (D) Quantification of the retinal layer thickness based on hematoxylin and eosin staining. No significant differences were found by a Student’s t-test. (E) Staining with fluorescently conjugated peanut agglutinin to label cones (red), and immunohistochemistry for caleretinin-positive amacrine and ganglion cells (green), and Brn3a-positive ganglion cells (blue) on retinal sections from WT and Opn4DTA/DTA mice. Scale bar = 100 µm. (F) Staining with fluorescently conjugated peanut agglutinin to label cones (red) and immunohistochemistry for γ−13 to label ON-bipolar cells (green) on retinal sections from WT and Opn4DTA/DTA mice. Scale bar = 100 µm. (G and H) We used two markers that label distinct populations of conventional RGCs: Brn3a is a marker for ~80% of conventional RGCs and it does not colocalize with melanopsin. SMI-32 labels alpha-like RGCs, a subset of which are M4 ipRGCs. Both RGC labeling methods showed no significant difference between Opn4DTA/DTA and WT. These data indicate that conventional RGCs and even a subtype of ipRGCs that expresses low levels of melanopsin are not ablated in Opn4DTA/DTA mice. Scale bar = 100 µm. (I) Density of cones, identified by staining with fluorescently conjugated peanut agglutinin, was not significantly different between Opn4DTA/DTA and WT. Scale bar = 50 µm. (J) We used ChAT staining to label Starburst amacrine cells, which are important for retinal waves. We found that the density of ChAT positive amacrine cells was similar between WT and Opn4DTA/DTA mice. Scale bar = 100 µm. (G–J) No significant differences were found by a Student’s t-test.
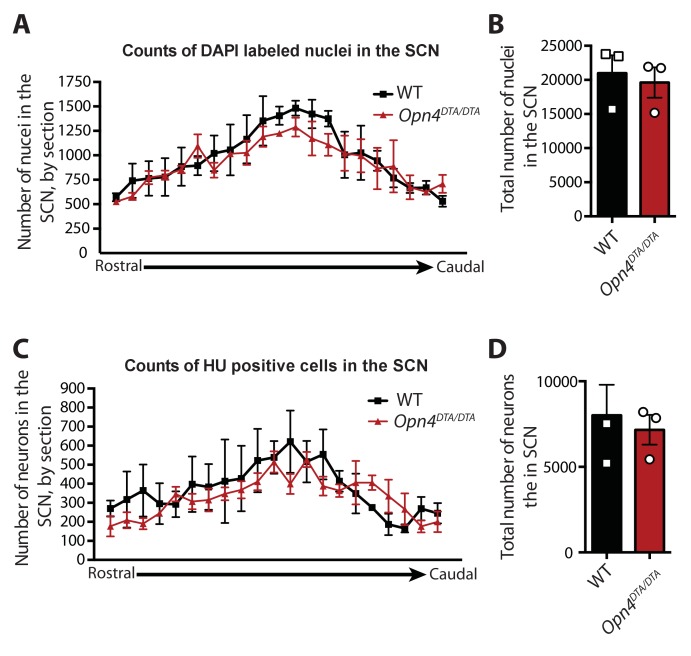
Figure 1—figure supplement 2. The number of cells in the SCN is unaffected in Opn4DTA/DTA mice.

Figure 1—figure supplement 2.

(A) Number of DAPI-labeled nuclei in the SCN of WT and Opn4DTA/DTA mice graphed rostral to caudal based on 25 μm coronal sections. (B) Total number of DAPI-labeled nuclei in the SCN of WT and Opn4DTA/DTA mice. (A) Number of neurons (identified by anti-Hu immunohistochemistry) in the SCN of WT and Opn4DTA/DTA mice by 25 μm coronal section graphed rostral to caudal based on 25 μm coronal sections. (B) Total number of neurons in the SCN of WT and Opn4DTA/DTA mice. (A and C) No significant differences by two-way ANOVA, Bonferroni's multiple comparisons test and adjusted p values. (B and D) No significant differences were found by a Student’s t-test. Error bars for all graphs represent s.e.m.