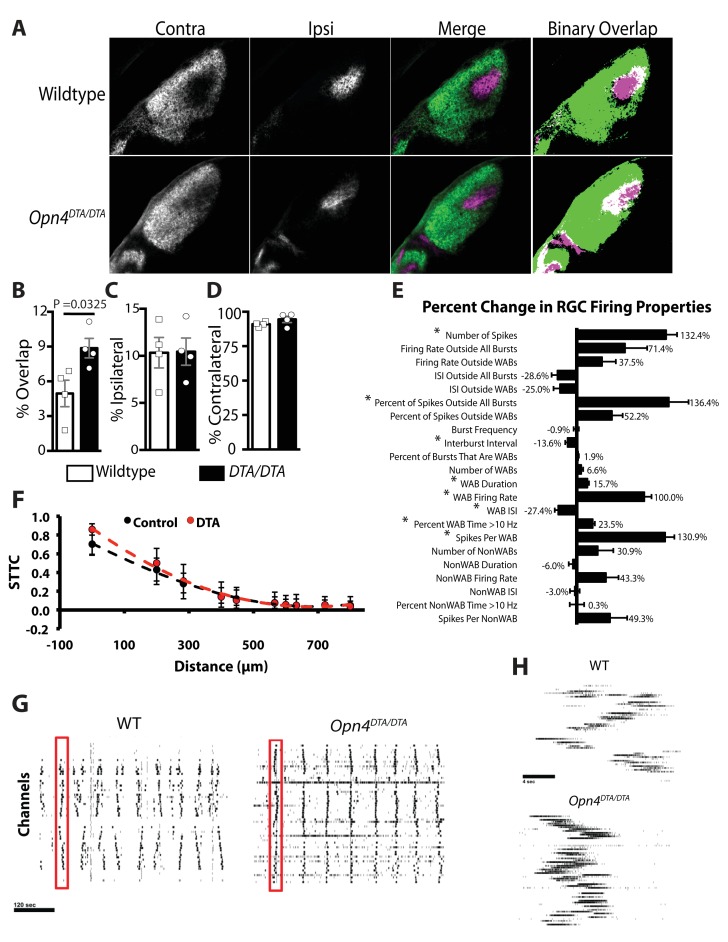
Figure 5. Opn4DTA/DTA mice display disrupted eye-specific axonal segregation as early as P8 and exhibit altered RGC firing properties.
(A) RGC axonal innervation of the dLGN in P8 wild-type (n = 4) and Opn4DTA/DTA (n = 4) mice as in Figure 3A. (B) At P8, Opn4DTA/DTA mice exhibit a significantly higher percentage of overlapping pixels relative to the total number of LGN pixels than wild-type mice. (C and D) The percentage of the total number of pixels in the dLGN from ipsilateral and contralateral fibers is similar among all tested genotypes. * indicates p<0.05 with Student’s t-test. Error bars represent s.e.m. for all graphs. (E) RGC spiking properties. Opn4DTA/DTA mice exhibit longer WABs and had a higher firing rate, with more spikes and a shorter inter-burst interval. There were also significantly more spikes outside of WABs. (F) Spike Time Tiling Coefficient (STTC) versus distance demonstrating that correlated spiking activity between neurons was similar in Opn4DTA/DTA mice compared to controls. 275 spike trains from wild-type/control, 245 from DTA. * represent statistically significant differences after Student's T-tests with a Holm-Bonferroni correction, α = 0.05, m = 22 for spiking properties, m = 10 for STTC.’ Exact p values are listed in Supplementary file 2. (G) Representative raster plots from multielectrode array recording of retinal waves in P6 WT and Opn4DTA/DTA mice in the dark. Each row represents the activity on a single electrode. (H) Expansion of one wave (identified by the red box in (G)). Error bars represent s.e.m. for all graphs.

