
Figure 1. Humanization of the murine MAb 12G4.
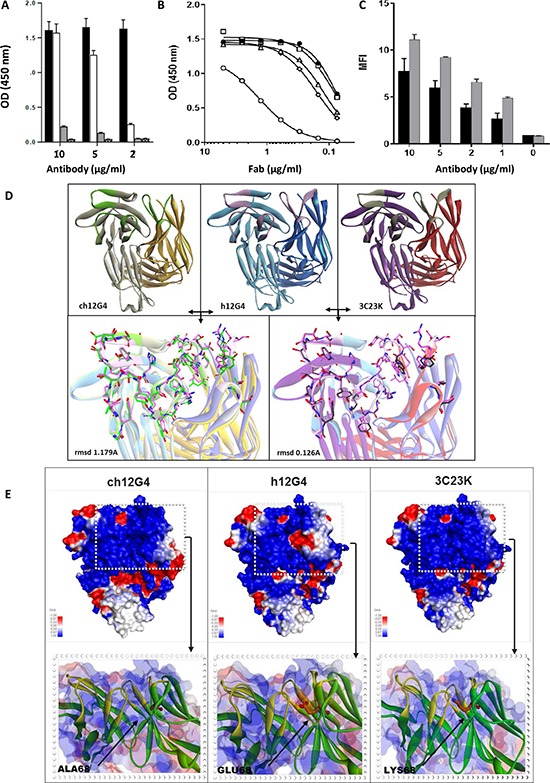
Panel (A) Comparison of the binding capacity of murine and humanized 12G4. In ELISA, MISRII-Fc was coated on titration plates and then antibodies were added at different concentrations before detection with the appropriate HRP-labeled secondary antibody. Black bars: murine 12G4; white bars: humanized 12G4 (h12G4), gray bars: uncoated control with murine 12G4; dashed bars uncoated control with h12G4. Panels B-C: Comparison of the binding capacity of humanized 12G4 (h12G4) and of the different affinity matured variants with that of murine 12G4. (B) In ELISA assays, microtiter plates were coated with MISRII-Fc and the tested Fabs were added at different concentrations before detection with an HRP-labeled secondary antibody. Black circles (●), murine 12G4; open circle(○), h12G4; open diamonds (◇), 6B78; open triangles (∆), 3C23; open squares (☐), 3C23K; (C) By cytometry analysis of COV434-MISRII cells using the antibodies 12G4 and 3C23K at 0, 1, 2, 5 or 10 μg/ml. Black bars: murine 12G4; Grey bars: 3C23K. Panels (D, E) Modeled structure of chimeric 12G4 (ch12G4), humanized 12G4 (h12G4) and affinity matured 3C23K using a sequence homology approach. Templates selected to build the initial model were the PDB structures 2OSL (for the light and heavy chains of ch12G4) and 3EO9 and 2EH7 (for the light and heavy chain of h12G4, respectively). (D) CDR loops, shown as sticks and with a different color than the light and heavy chains, were specifically rebuilt and refined using the Discovery Studio software (Modeler and Looper algorithms). The 3C23K model was built from the h12G4 model by replacing the four residues mutated during the maturation affinity process (I47T, S49P, E54K, Q216R showed as sticks and balls). The conformation of the mutated residues and of the surrounding residues that lie within a 5Å cutoff radius was optimized using the MODELER algorithm. (E) The electrostatic potentials of the three MAbs, calculated with the Delphi program included in the Discovery studio software, are visualized using a surface graphic view. Highly negative and highly positive regions are indicated in red and blue, respectively.