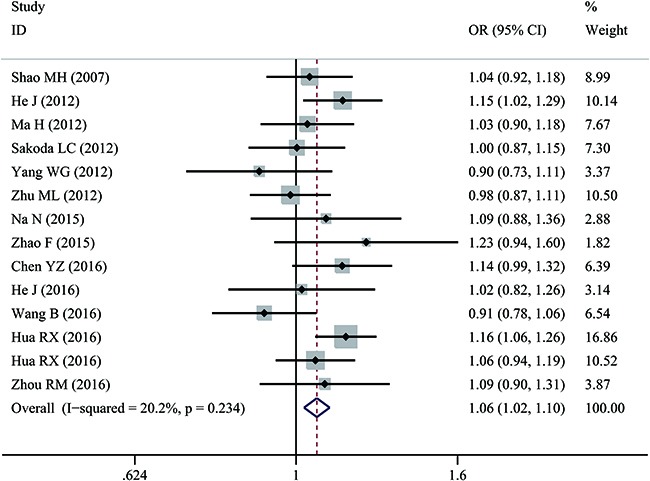
Figure 2. Forest plot of overall cancer risk associated with rs873601 G>A in the XPG gene under an allele contrast model.

For each study, estimated ORs and 95% CIs are plotted with a box and horizontal line, respectively. (◇, pooled ORs and associated 95% CIs).
