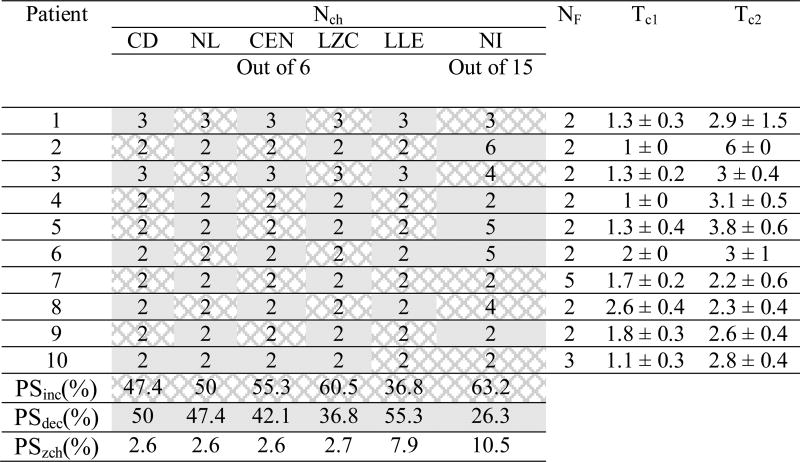
Table 3.
Optimal thresholds used for seizure prediction in iEEG data from patients with focal hippocampal epilepsy.
Nch : number of channels; NF: number of features; Tc1 and Tc2: significance thresholds for raising flags II and III (see Section 2.2 for details); CD: correlation dimension; NL: noise level; CEN: correlation entropy; LZC: Lempel-Ziv complexity; LLE: largest Lyapunov exponent ; NI: nonlinear interdependence. PSinc, PSdec and PSzch are the percentages of seizures showing significant preictal increase (dark gray), decrease (light gray) and no change, respectively, in comparison with reference periods. Results are expressed as mean ± absolute deviation. Similarly, the dominant preictal changes in the median of feature values have been shown for each patient separately.

