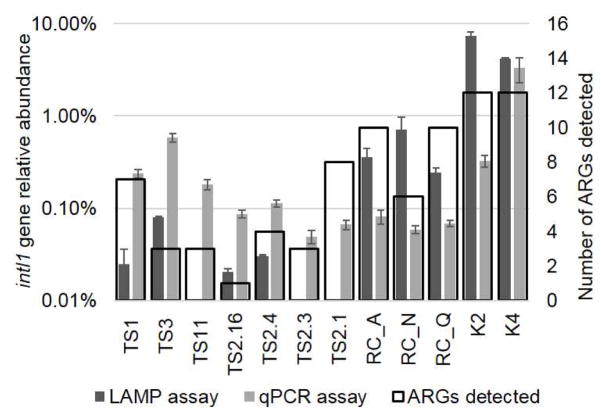
Fig. 3.
The intI1 gene assays measured in 12 environmental samples. (A) Filled bars indicate average relative abundance measured using LAMP or qPCR assays, and error bars indicate standard error of mean. The secondary axis and open black bars indicate number of ARGs detected using the qPCR array. Sample abbreviations indicate samples from the Tittabawassee and Saginaw Rivers in Michigan (TS), the Red Cedar River in Michigan (RC), and water samples from the Geum River system in Republic of Korea (K).

