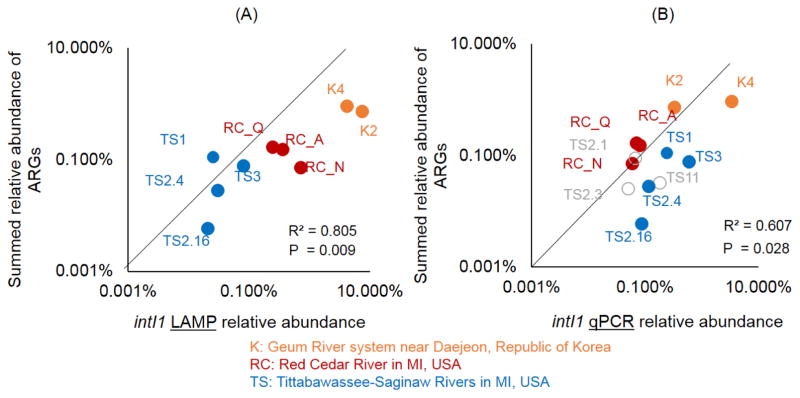
Fig. 5.
Comparing intI1 gene LAMP and qPCR assays with total abundance of ARGs. (A) LAMP and (B) qPCR assay relative abundance versus total relative abundance of ARGs. The y-axis shows the sum relative abundance of 35 ARGs detected in one or more of 12 environmental samples tested on the ARG array. Sample abbreviations and colors indicate river sediment samples. The intI1 gene LAMP assay was not detected in three of the TS samples (marked in gray).

