Figure 4.

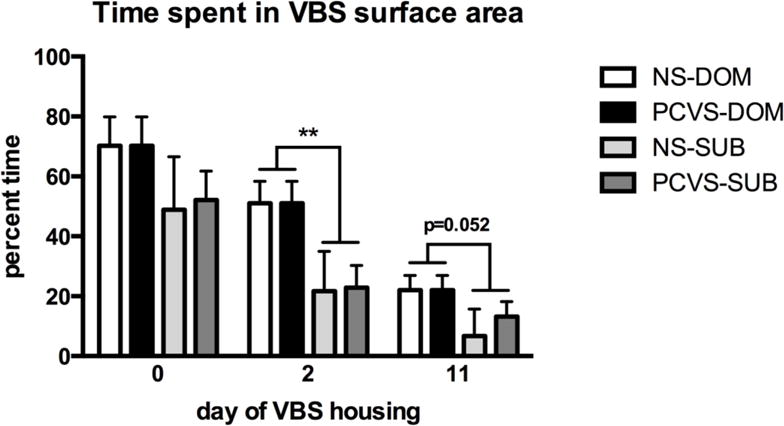
Percentage of time spent in the SFC area. DOM (n=18) spent significantly more time in the SFC area than SUB (n=18) on D2, but there was no effect of, or interaction with prenatal treatment. Data are expressed as mean +/− SEM. **p <0.01.

Percentage of time spent in the SFC area. DOM (n=18) spent significantly more time in the SFC area than SUB (n=18) on D2, but there was no effect of, or interaction with prenatal treatment. Data are expressed as mean +/− SEM. **p <0.01.