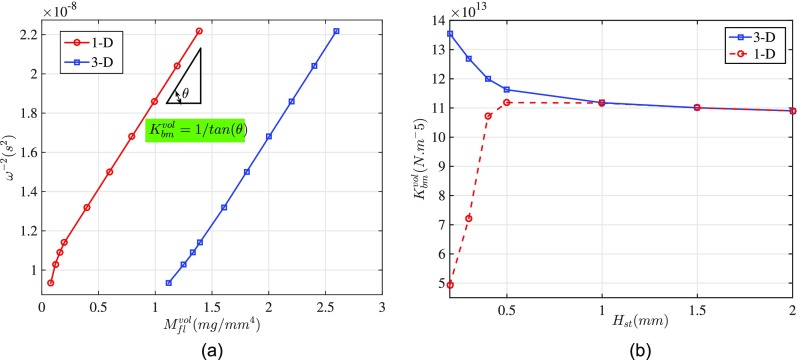
FIG. 9.
(Color online) Estimation of the cochlear partition volumetric stiffness from the velocity frequency response. (a) Square inverse of the BM resonance (characteristic) frequency (from FEM simulation, model A) versus volumetric added mass, calculated from 1D control volume analysis [Eq. (6)] and 3D analytical model [Eq. (B11)]. (b) Volumetric stiffness calculated from inverse of slopes of curves in (a), assuming a simple harmonic characteristic for the cochlear segment. The OoC volumetric stiffness approximated from the two models are the same () and match the exact volumetric stiffness of the segment, calculated by the FEM model () for uniform pressure on the BM and low frequency stimulation.

