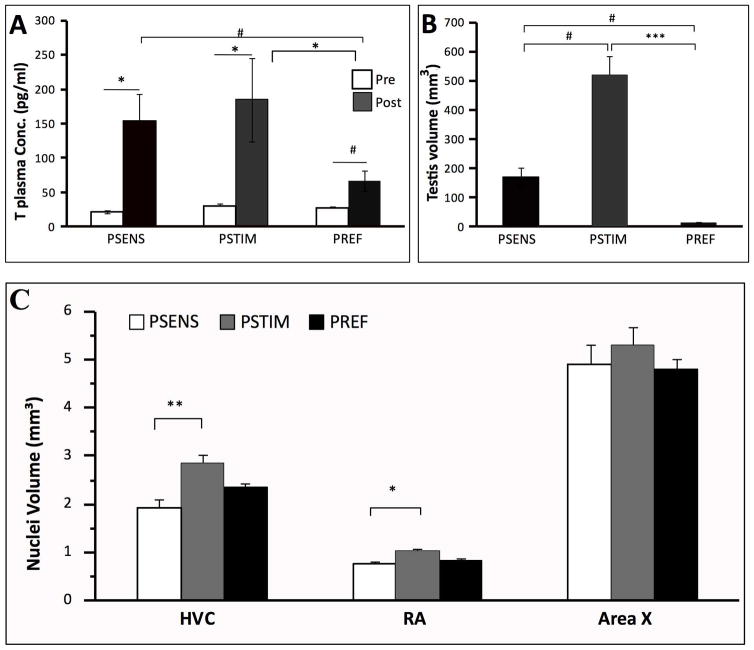
Figure 2.
Effects of photoperiodic manipulations on plasma testosterone concentrations (A), left testis volumes (B), and volumes of song control nuclei HVC, RA and Area X (C) in male starlings. Testosterone concentrations were measured before (Pre) and at the end (Post) of the experiment. Nuclei volumes are the average left and right nuclei. Data were analyzed by Kruskal-Wallis non parametric ANOVA followed when significant by post-hoc tests. Pre and Post concentrations of testosterone were also compared within each group by Wilcoxon tests. *= p<0.05, ***=p<0.001, #=p<0.10.

