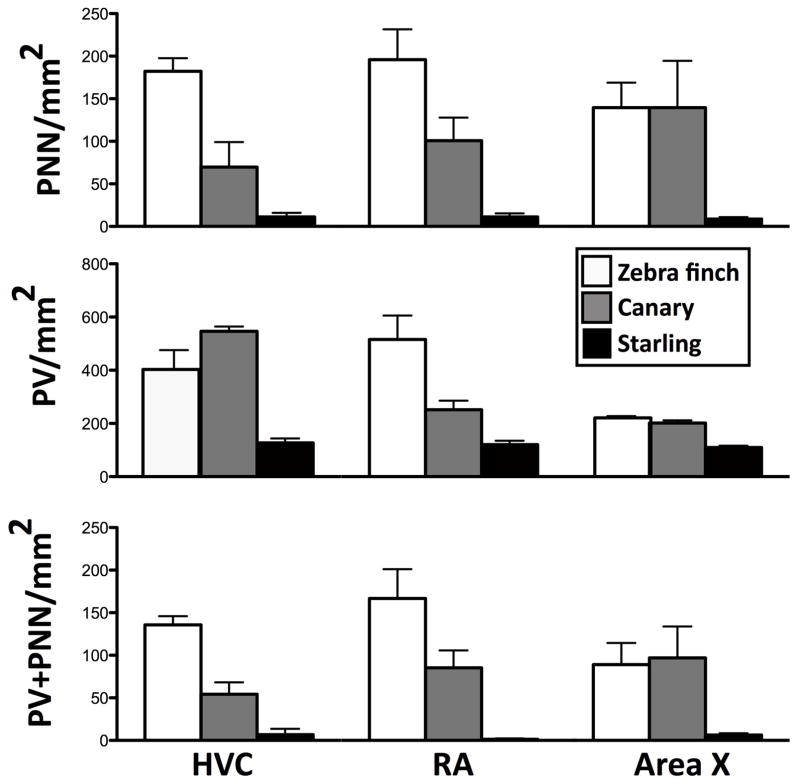
Figure 7.
Comparison of the density (numbers/mm2) of PNN (top), PV-positive cells (middle) and PV cells surrounded by PNN (bottom) in the HVC, RA and Area X of the three species based on brain sections from 3 subjects in each species stained in the same assay. The pattern of species differences is very similar to the pattern observed with data coming from separate staining batches.

