
Figure 2.
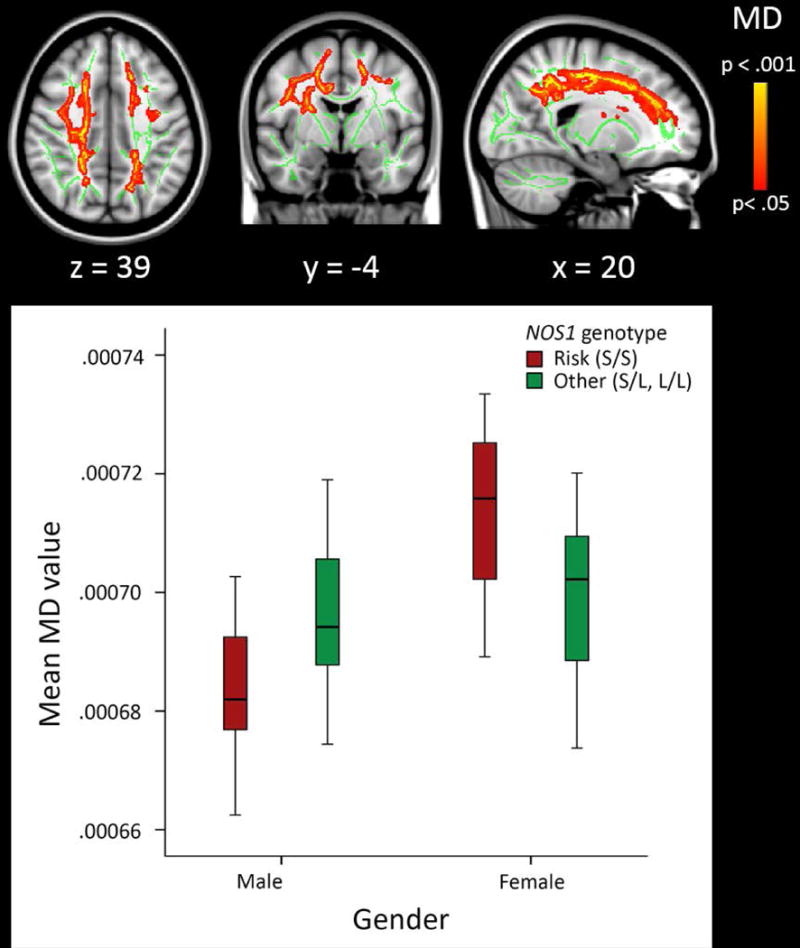
Main results from the voxelwise tract-based spatial statistics (TBSS) analysis. For visualisation of the interaction between NOS1 genotype and gender, mean MD value derived from all significant clusters are plotted, stratified by gender.
Note. Results are overlaid on a standard MNI152 template with the mean skeleton in green (FA>0.3), and were “thickened” towards the full width of the tract for visualization purposes.