
Figure 4.
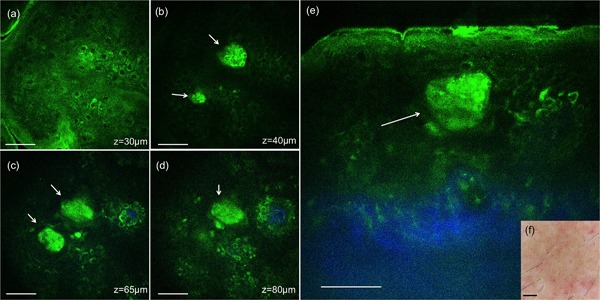
In vivo MPM images of human skin 24 hours post‐treatment, 1064 nm. (a–d) En‐face MPM images (XY scans) showing keratinocytes in the epidermis and clusters of individual damaged cells (white arrows) at z = 30 µm (a), 40 µm (b), 65 µm (c), and z = 80 µm (d). (e) Cross‐sectional view (XZ scan) representing a vertical plane through the same interrogating volume corresponding to the en‐face images on the left. The image shows a cluster of damaged cells (white arrow) in the epidermis. Scale bar is 40 µm in all MPM images. (f) Clinical image (DermLite FOTO, Dermlite Inc.). Scale bar is 1 mm.