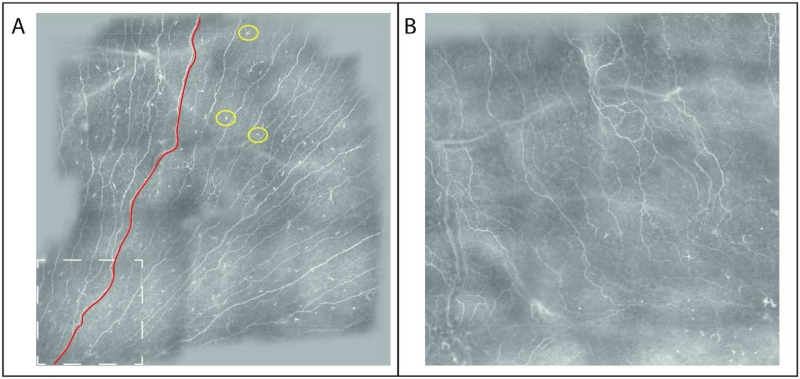
Figure 1. Composite image of the corneal subbasal nerve plexus.
The device’s software automatically fuses repeated section measurements in a composite image. A) Sample image of a healthy control subject. The dashed white box depicts the size of one section image. A sample corneal nerve segment is delineated in red, sample dendritic cells shown by a yellow circle. B) Sample image of a multiple sclerosis patient.

