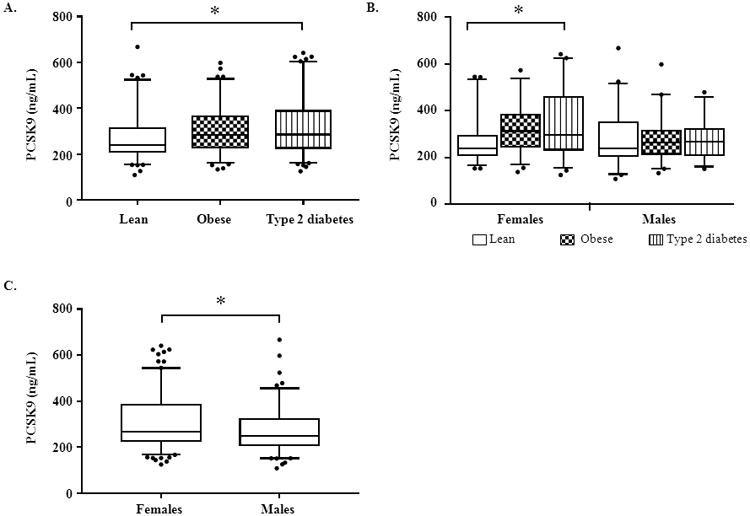
Figure 1.

A: Comparison of PCSK9 levels by group. B: Comparison of PCSK9 levels by group within each sex. C: Comparison of PCSK9 levels by sex. The boxes denote the distribution between the 75th and 25th percentiles; the horizontal lines within the boxes denote the median values; the whiskers represent the 5th and 95th percentiles. Closed circles represent individuals below the 5th or above the 95th percentiles. The asterisk indicates a P-value of <0.01 between the groups by ANOVA (A, B) or independent t-test (C).
