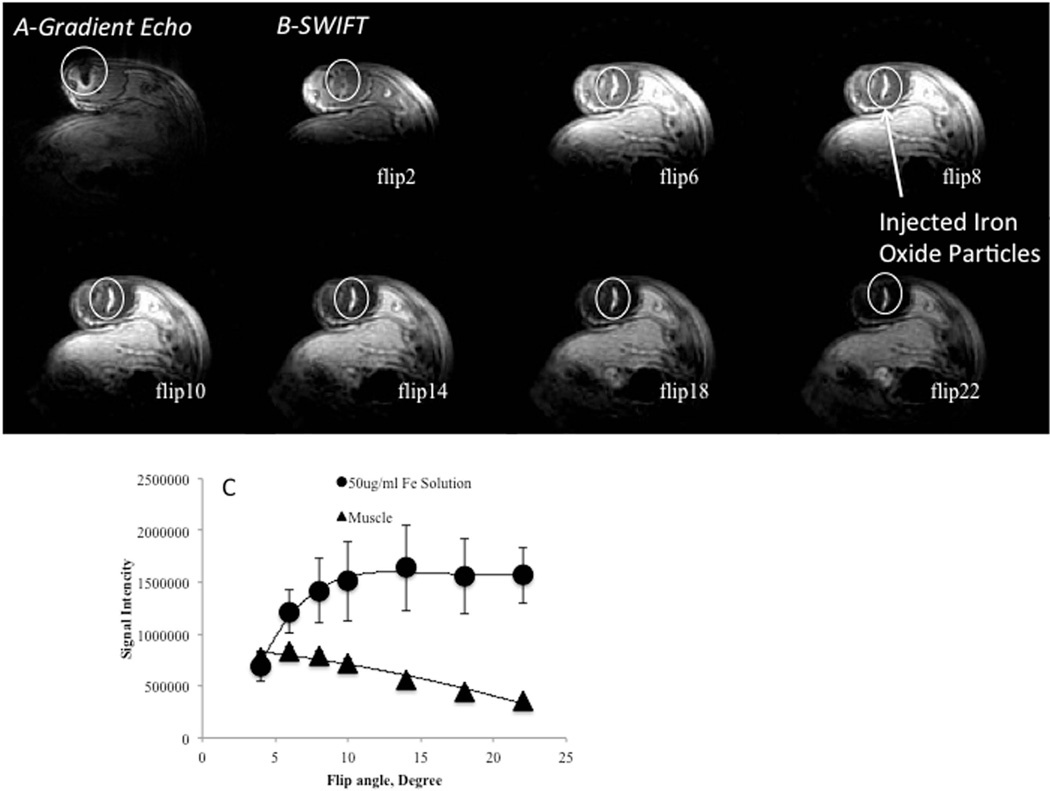
Figure 3. MR images of mouse hindlimb after administration iron oxide solution.
(A) – Gradient echo image of mouse hindlimb after administration of 50 µl of 50 µg/ml of the iron oxide solution. Circle is a hypointense area from iron labeled cells.
(B)- SWIFT images of the same hindlimb (A) acquired at different excitation flip angles. Hyperintense signal reached the maximum at ~ 10-degree excitation flip angle.
(C)– Signal intensity of the tissue and the injected site at different excitation flip angle.
SWIFT pulse sequence generates hyperintense MRI signal from iron oxide solution in tissue.

