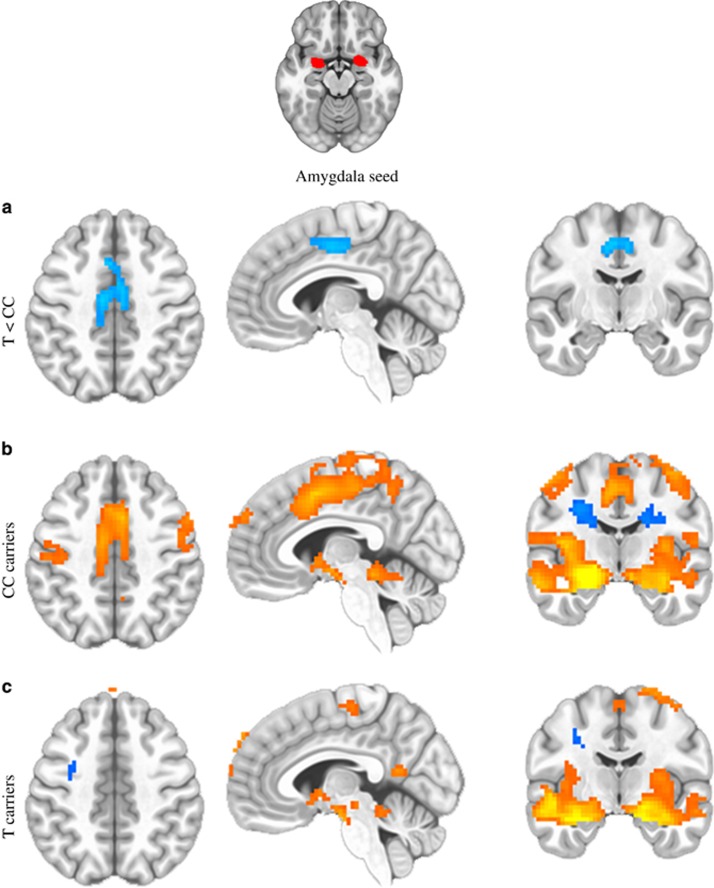
Figure 4.
HDAC4 genotype (rs7570903) effects on amygdala functional connectivity at rest. The CC genotype groups show significant increased functional coupling of the amygdala–cingulate circuitry compared with those with the CT/TT genotype. (a) Group differences are shown in the horizontal (left), sagittal (middle) and coronal (right) planes between the groups. (b) Regions associated with amygdala functional activity at resting state in the CC genotype group. (c) Regions associated with amygdala functional activity at resting state in those with the CT/TT genotypes. Orange is indicative of significant positive associations/greater connectivity, and blue is indicative of significant negative associations/lesser connectivity. All signals represent whole-brain corrected voxels at P<0.05.

