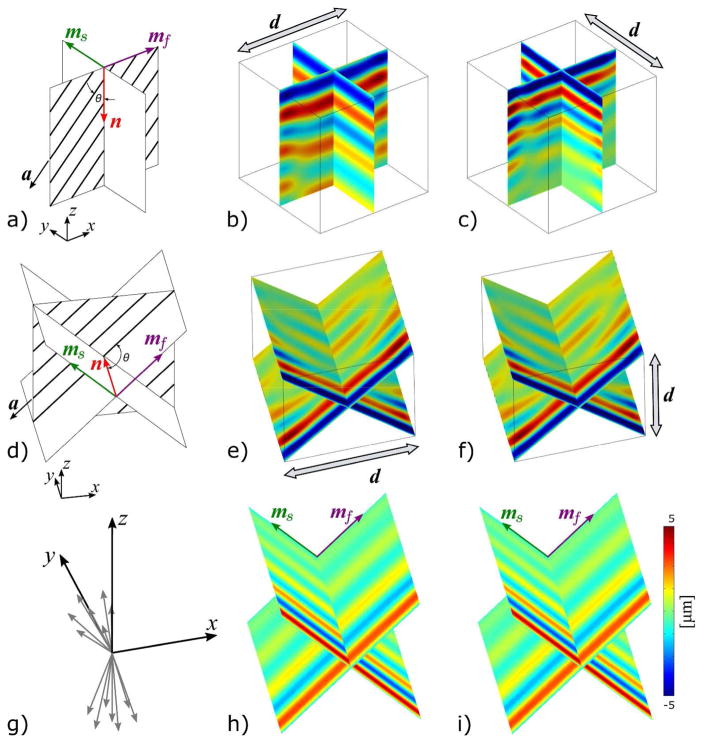
Figure 2.
Approach for simulation of wave propagation in an ITI, homogeneous material with the material parameters shear modulus μ = 1000 Pa, shear anisotropy ϕ = 1, tensile anisotropy ζ = 2, and loss modulus η = 0.2. The cube volume is 50×50×50 mm3 with a voxel size of 1 mm3, and the fiber direction is given by . The top xy-plane is excited with 5 N/m2 at 100 Hz in the (b) x-direction and (c) y-direction. This excitation is expected to result in a primary propagation direction of n = −z. The expected primary polarizations for both simulations in (b) and (c) are shown in (a). For the simulations in which The xz-plane is excited with 5 N/m2 at 100 Hz in the (e) x-direction and (f) z-direction, the expected primary propagation direction is n = y. The expected primary polarizations for both simulations in (e) and (f) are shown in (d). The displacement in the x-direction is plotted in (b) and (e), the displacement in the y-direction is plotted in (c), and the displacement in the z-direction is plotted in (f). Directionally-filtered (DF) displacements from (e) are shown in (h), and DF displacements from (f) are shown in (i). In both cases, the assumed primary polarizations from (d) are used for the filter. Displacements for the slow and fast shear waves are plotted in the planes containing the ms and mf polarizations, respectively. Note that the fast shear waves have longer wavelengths than the slow shear waves. The set of filter directions in (g) were used as the filter directions in Table 3.

