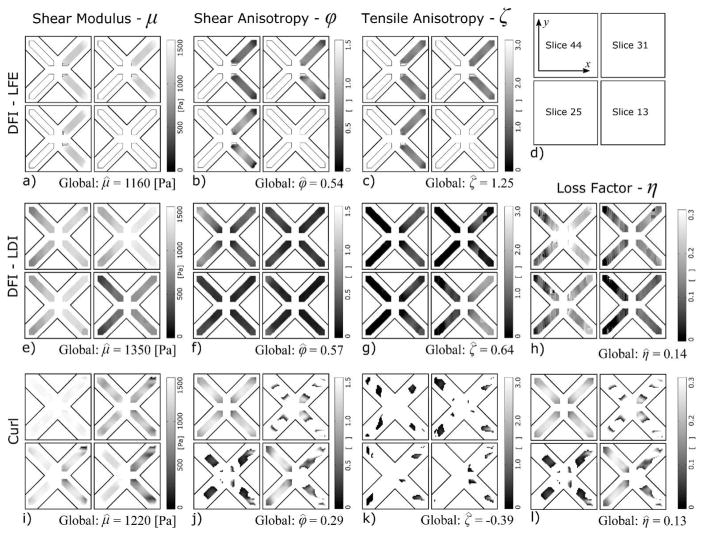
Figure 6.
Local and estimates of parameters from combining the three simulations of waves in heterogeneous material are shown for the xy-planes of 13, 25, 31, and 44. The outlining box indicates the full extents of the material (70 nm × 70 nm), and the outlined “X” within each box indicates the outline of the 4 lobes. The outer 4 voxels have been removed from the estimates leaving a smaller shaded “X” region of local parameter estimates. Color bars show a range for each material parameter from a minimum value of zero to a maximum value of 150% of the known values of μ = 1000 Pa, ϕ = 1, ζ = 2, and η = 0.2. Global estimates are given under the local results for each parameters and method. Estimates obtained by the DFI-LFE method for (a) μ, (b) ϕ, and (c) ζ are shown in the top row. The smaller outlines in (a), (b), and (c) indicate areas for which the DFI-LFE indicated that insufficient information was available for estimates. Estimates obtained by the DFI-LDI method for (e) μ, (f) ϕ, (g) ζ, and (h) η are shown in the second row. Estimates obtained by the Curl method for (i) μ, (j) ϕ, (k) ζ, and (l) η are shown in the last row. Note that in the case of the DFI-LDI and Curl methods, estimates were found for all voxels and the white areas are outside the chosen range of the material parameters.

