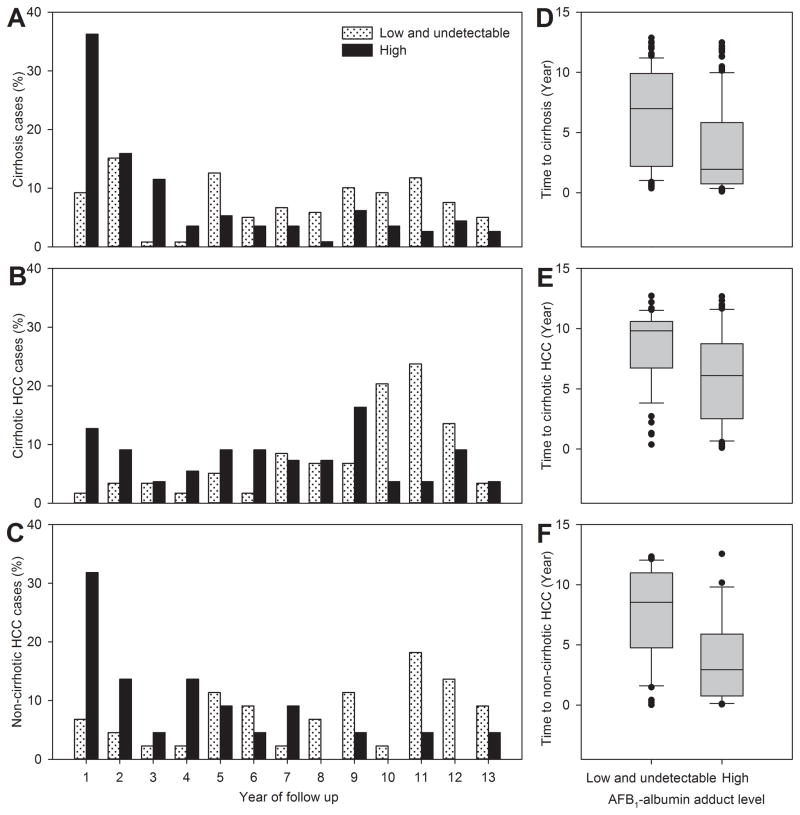
Figure 2.
Frequency distribution and box plot of time intervals from study entry to diagnosis of newly-developed cirrhosis, cirrhotic HCC and non-cirrhotic HCC by serum levels of AFB1-albumin adducts at study entry. (A) Distribution of time intervals from study entry to cirrhosis diagnosis in cases (n=232) with high or low/undetectable serum AFB1-albumin adduct levels (p<0.0001). (B) Distribution of time intervals from study entry to diagnosis of cirrhotic HCC in cases (n=114) with high or low/undetectable serum AFB1-albumin adduct levels (p=0.0001). (C) Distribution of time intervals from study entry to diagnosis of non-cirrhotic HCC in cases (n=66) with high or low/undetectable serum AFB1-albumin adduct levels (p=0.0025). (D) Box plot of time intervals (means ± SD) from study entry to diagnosis of cirrhosis in cases with high (3.6±3.7) and low/undetectable (6.5±3.8) serum levels of AFB1-albumin adducts (p<0.0001). (E) Box plot of time intervals (means ± SD) from study entry to diagnosis of cirrhotic HCC in cases with high (6.0±3.7) and low/undetectable (8.6±9.8) serum levels of AFB1-albumin adducts (p<0.0001). (F) Box plot of time intervals (means ± SD) from study entry to diagnosis of non-cirrhotic HCC in cases with high (3.6±3.5) and low/undetectable (7.7±3.8) serum levels of AFB1-albumin adducts (p<0.0001). In the box plot, the filled circles indicate the outliers lying outside the 10th and 90th percentiles.

