Figure 2.
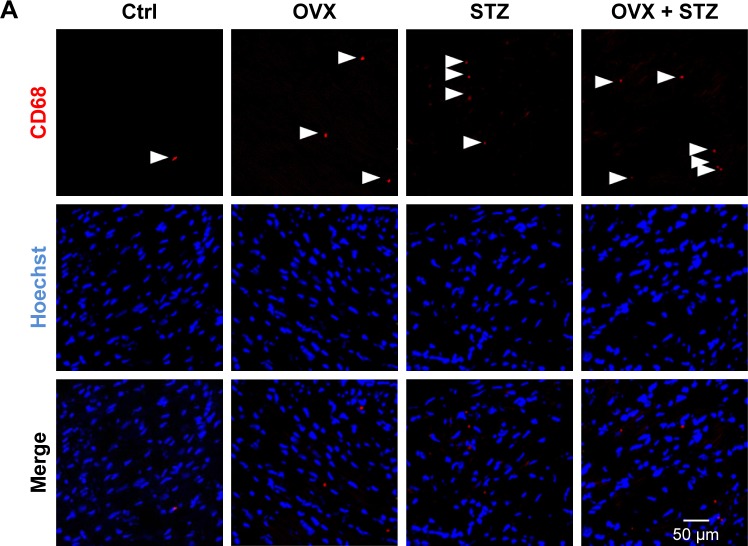
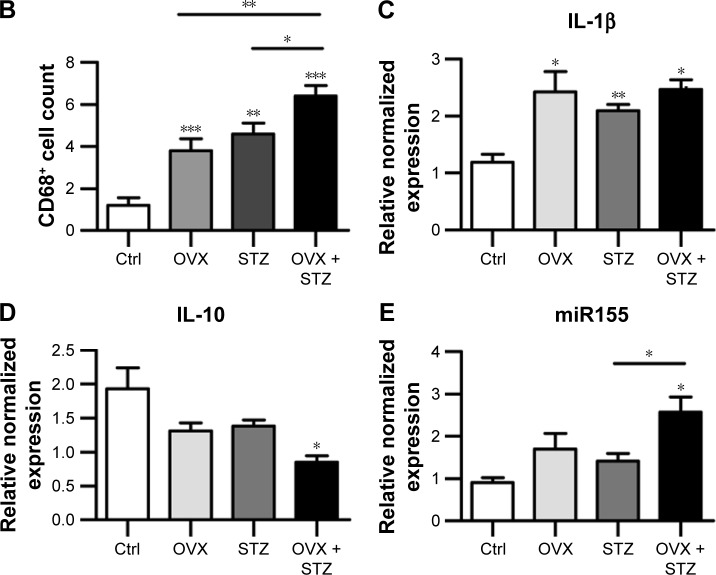
Increased M1 polarization in OVX diabetic mice.
Notes: (A) Immunofluorescence confocal images of macrophages (arrowheads) in the hearts from the indicated groups, in which macrophages were stained with anti-CD68 (red) and nuclei were stained with Hoechst (blue). Scale bar =50 μm and applies to all images. (B) Quantification of the infiltrated macrophages in the hearts from the indicated groups (mean ± SEM, analyzed from 4 representative sections from 4 mice in each group). Quantitative PCR data of IL-1β (C), IL-10 (D), and miR155 (E) expression in the hearts from the indicated groups (mean ± SEM of 4 mice in each group). *P<0.05, **P<0.01, and ***P<0.001.
Abbreviations: Ctrl, control; Hoechst, Hoechst 33258; IL, interleukin; M1, pro-inflammatory type 1 macrophage; OVX, ovariectomized; SEM, standard error of the mean; STZ, streptozotocin; PCR, polymerase chain reaction.


