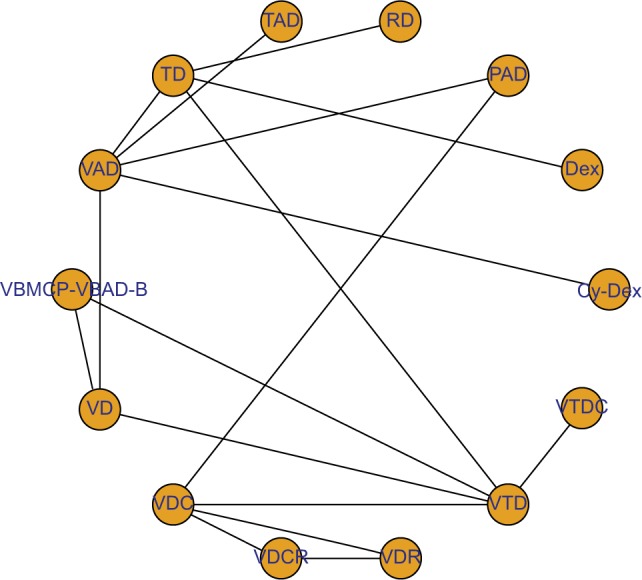
Figure 2.

Network plot of induction treatments included in the NMA.
Notes: Circles represent the intervention as a node in the network, lines represent direct comparisons using RCTs, and the thickness of lines corresponds to the number of RCTs included in each comparison.
Abbreviations: Cy-Dex, cyclophosphamide plus dexamethasone; NMA, network meta-analysis; PAD, bortezomib plus doxorubicin plus dexamethasone; RCTs, randomized controlled trials RD, lenalidomide plus dexamethasone; TAD, thalidomide plus doxorubicin plus dexamethasone; TD, thalidomide plus dexamethasone; VAD, vincristine plus doxorubicin plus dexamethasone; VBMCP-VBAD-B, BCNU plus vincristine plus melphalan plus prednisone plus dexamethasone plus bortezomib; VD, bortezomib plus dexamethasone; VDC, bortezomib plus dexamethasone plus cyclophosphamide; VDCR, bortezomib plus dexamethasone plus cyclophosphamide plus lenalidomide; VDR, bortezomib plus dexamethasone plus lenalidomide; VTD, bortezomib plus thalidomide plus dexamethasone; VTDC, bortezomib plus thalidomide plus dexamethasone plus cyclophosphamide.
