
Figure 2.
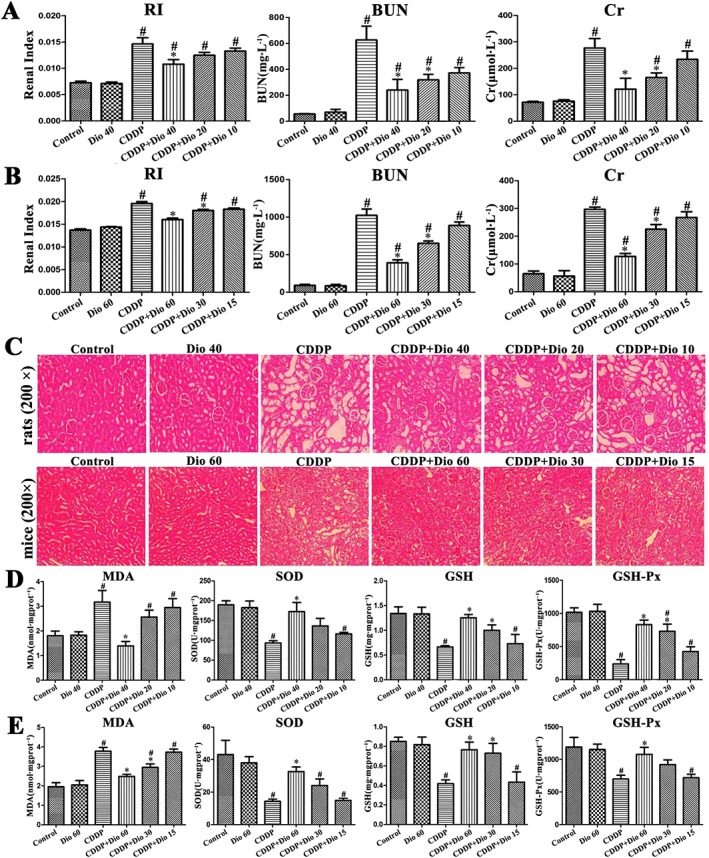
Effects of dioscin on CDDP‐induced nephrotoxicity in rats and mice. (A) Effects of dioscin on RI and serum Cr and BUN levels in rats. (B) Effects of dioscin on RI and serum Cr and BUN levels in mice. (C) H&E staining (200× original magnification) of the kidney tissue in rats and mice. (D) Effects of dioscin on MDA, SOD, GSH and GSH‐Px levels in renal tissues from rats. (E) Effects of dioscin on MDA, SOD, GSH and GSH‐Px levels in renal tissues from mice. Data are presented as the mean ± SD (n = 8). # P < 0.05, significantly different from control group; *P < 0.05, significantly different from CDDP groups.