
Figure 9.
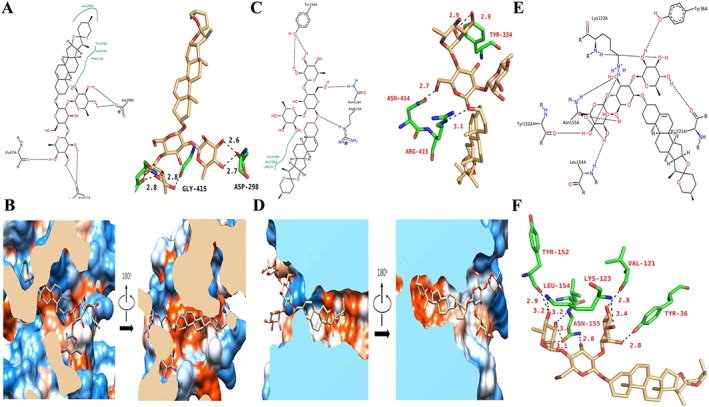
Targets of dioscin against CDDP‐induced nephrotoxicity. (A) The schematic and the three‐dimensional diagram of the hydrogen bond interaction between dioscin and Sirt1. (B) Hydrophobic effect between dioscin and Sirt1. The strong hydrophobic regions are orange, and the strong hydrophilic regions are blue. The stick model of dioscin is coloured in grey. (C) The schematic diagram and the three‐dimensional diagram of the hydrogen bond interaction between dioscin and Keap1. The three‐dimensional diagram of the hydrogen bond interaction between dioscin and Keap1. (D) Hydrophobic interactions between dioscin and Keap1. The strong hydrophobic regions are orange, and the strong hydrophilic regions are blue. The stick model of dioscin is coloured in light yellow. (E, F) The schematic diagram and the three‐dimensional diagram of the hydrogen bond interaction between dioscin and NF‐κBp65.