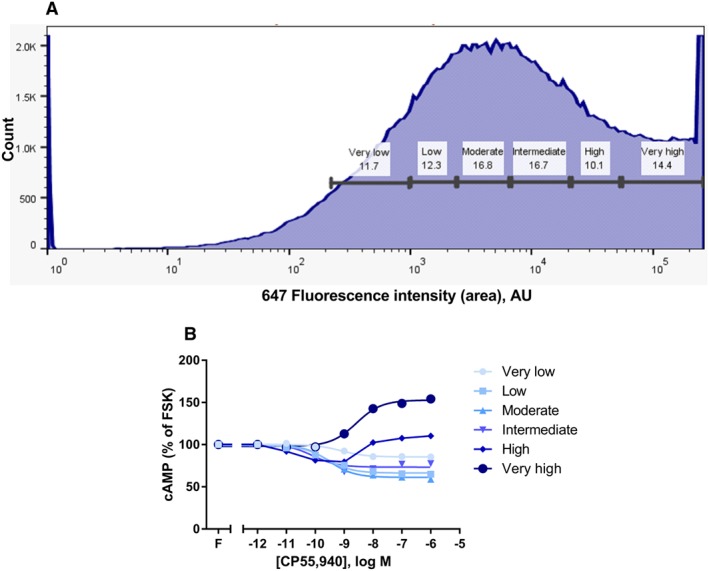
Figure 3.

FACS frequency distribution (A), showing live‐gated HEK Flp‐In™ cells stably expressing V8‐CAMYEL, sorted into six subpopulations on the basis of transient pplss‐3HA‐hCB1 surface expression level (647 fluorophore staining intensity). Panel (B) shows cAMP concentration–response curves for CP55,940 in the presence of 5 μM forskolin (FSK; ‘F’), performed on cells from each sorted cell population. Representative data are presented, demonstrating mean ± SEM of technical duplicates.
