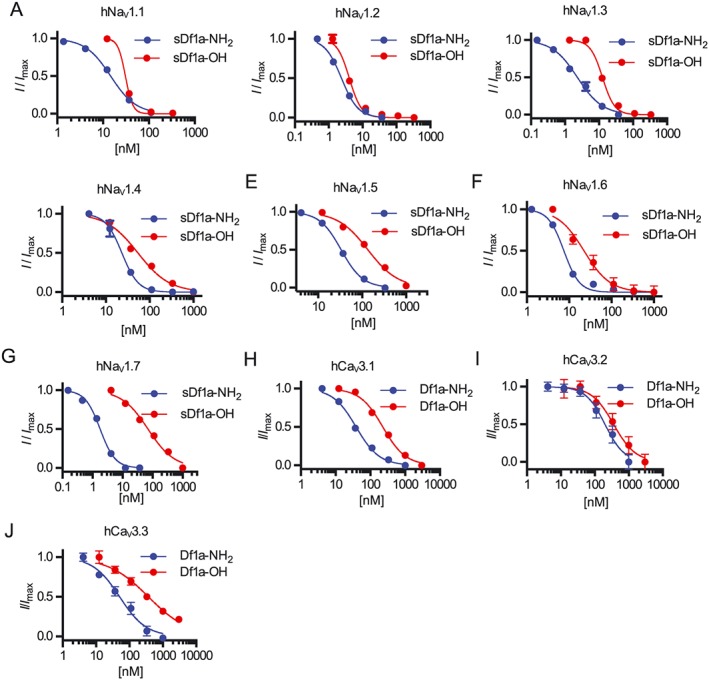
Figure 3.

Inhibition of hNaV and hCaV3 subtypes by μ‐TRTX‐Df1a measured by automated patch clamp electrophysiology in QPatch 16X. Holding potential was −80 mV for hNaV and −90 mV for hCaV3. Na+ currents were elicited by 20 ms voltage steps to 0 mV from a −120 mV conditioning pulse applied for 200 ms, and Ca2+ currents were elicited by 60 ms voltage steps to −30 mV from a −120 mV conditioning pulse applied for 60 ms. Representative concentration–response curves for inhibition of (A) hNaV1.1, (B) hNaV1.2, (C) hNaV1.3, (D) hNaV1.4, (E) hNaV1.5, (F) hNaV1.6, (G) hNaV1.7, (H) hCaV3.1, (I) hCaV3.2 and (J) hCaV3.3. The IC50 values, calculated using I/I max values and non‐linear regression, were (in nM) 14.3 ± 0.1 (n = 5) and 30.7 ± 2.2 (n = 6) for hNaV1.1, 1.9 ± 0.5 (n = 5) and 3 ± 1.4 (n = 5) for hNaV1.2, 3 ± 0.7 (n = 5) and 10 ± 1 (n = 8) for hNaV1.3, 24 ± 1.8 (n = 5) and 53.6 ± 12 (n = 6) for hNaV1.4, 45.3 ± 6.8 (n = 5) and 125.6 ± 21 (n = 5) for hNaV1.5, 7.6 ± 0.4 (n = 5) and 23 ± 2.9 (n = 7) for hNaV1.6, 1.9 ± 0.08 (n = 6) and 60.5 ± 6.1 (n = 6) for hNaV1.7, 44.6 ± 5.8 (n = 8) and 216 ± 28.1 (n = 7) for hCaV3.1, 253 ± 45.7 (n = 6) and 371 ± 48.8 (n = 6) for hCaV3.2 and 48.4 ± 7.2 (n = 5) and 460 ± 43.7 (n = 7) for hCaV3.3, under application of sDf1a‐NH2 and sDf1a‐OH respectively. Data are presented as mean ± SEM from described n independent experiments; one cell was considered an independent experiment.
