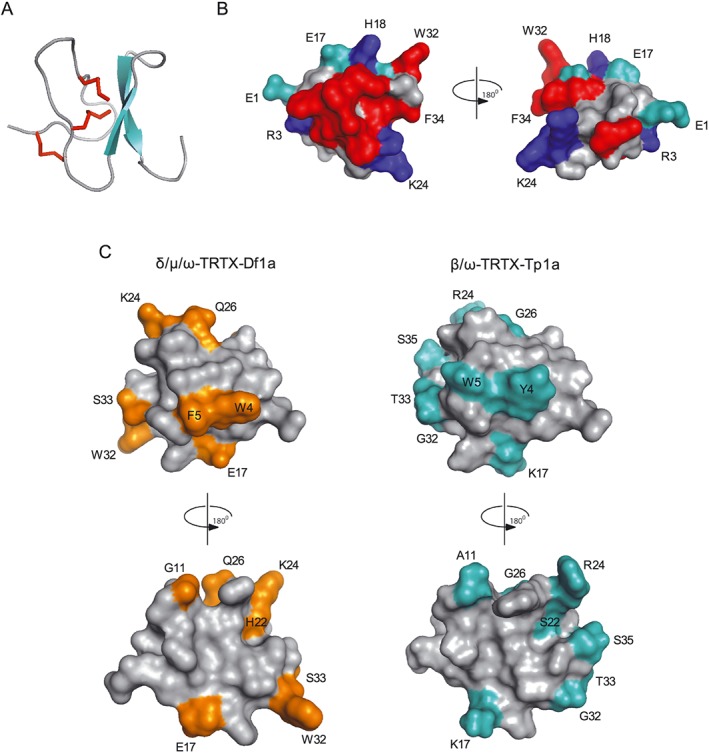
Figure 9.

Molecular modelling and structural features of μ‐TRTX‐Df1a. The three dimensional structure of Df1a was modelled using the NMR structure of β/ω‐theraphotoxin‐Tp1a (ProTx‐I) (Gui et al., 2014). (A) Ribbon representation showing β‐sheet (cyan) and Cys‐bridges (red) of a typical ICK peptide. (B) Surface representation of Df1a structure with 180° rotation shown in cyan: negatively charged, blue: positively charged and red: hydrophobic residues (aromatics). Residues present in these regions are labelled (E1, R3, E17, H18, K24, W32 and F34). (C) Comparison of the structures of Df1a and ProTx‐I. The differences in amino acids residues between these toxins are highlighted in orange and cyan respectively. These residues are W4Y, F5W, G11A, E17K, H22S, K24R, Q26G, W32G, S33T for Df1a and ProTx‐I, respectively, and S35 is present only in ProTx‐I. Structures are shown in two orientations, rotated by 180°.
