Figure 3.

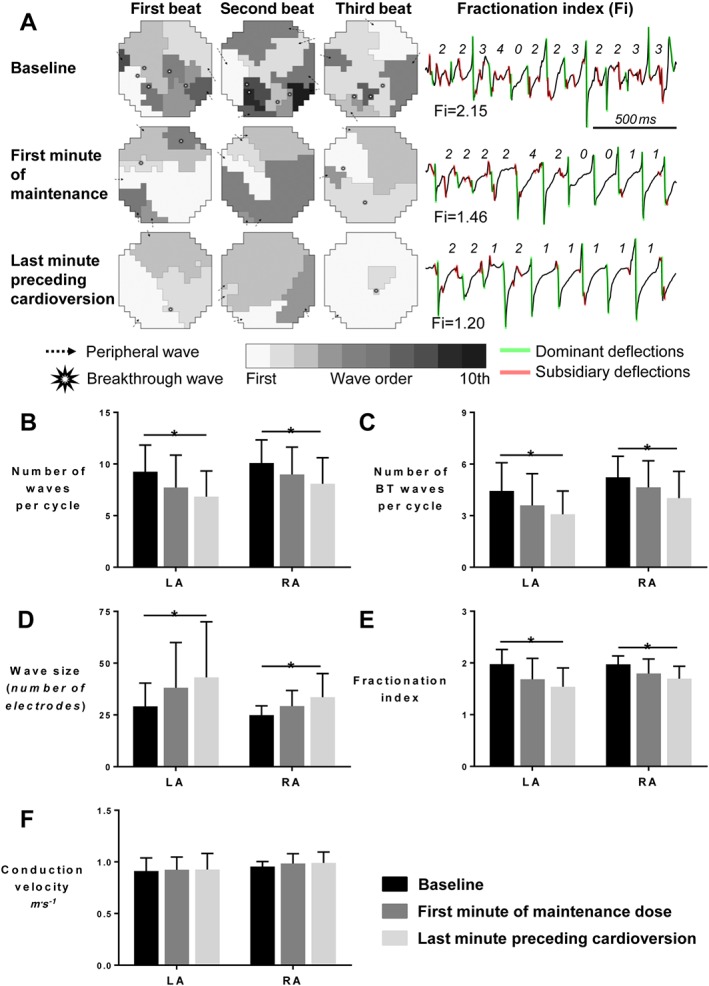
PA‐6 decreases the complexity of atrial fibrillation for LA and RA. (A) Fibrillation patterns. Wave maps of three consecutive AF beats at baseline, at the first minute of maintenance and at the last minute preceding cardioversion (left panel) reconstructed based on the mapping data acquired with LA spoon electrode (Ø 4 cm, 247 electrodes, interelectrode distance 2.4 mm). Wave maps depict the total number of waves, origin of the waves (peripheral and breakthrough), wave size and wave order. The right panel depicts the calculation method of the unipolar fractionation indexes at one electrode for three different time points according to dominant activations. The fractionation index is calculated as the ratio between the number of dominant (green) and subsidiary (red) deflections. (B) Total number of waves per cycle, (C) number of epicardial breakthrough waves per cycle, (D) wave size expressed as mean number of electrodes assigned to one wave, (E) fractionation index (mean values of ratios of remote to local deflections per electrode) and (F) mean conduction velocity for each electrode. Data for n = 5 goats displaying cardioversion are depicted in panel B–F. * P < 0.05, significantly different as indicated.
