
FIGURE 3.
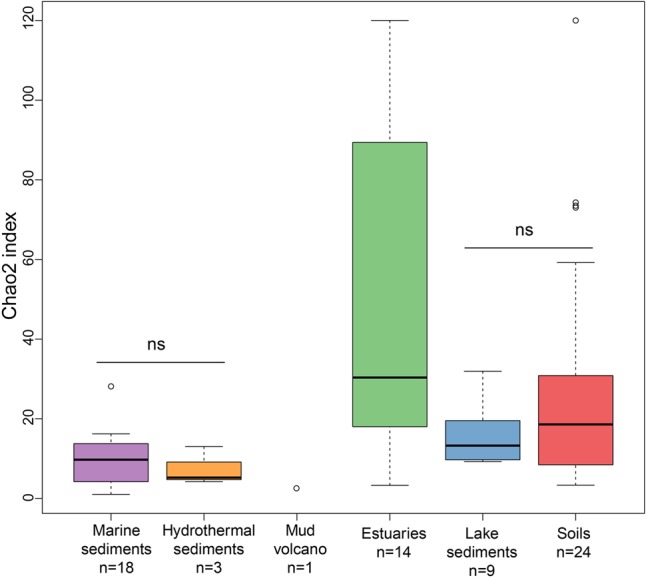
Box plot of Chao2 indices of the different ecosystem types. The plot is based on subsampled datasets containing 15 sequences for each site to make the comparison on alpha diversity measures more robust. The number of samples in each habitat is given as ‘n’ underneath the habitat label. The ‘ns’ donates no statistical significance in Wilcoxon test. The statistical result of alpha diversity at OTU level is given in Supplementary Table S3.