
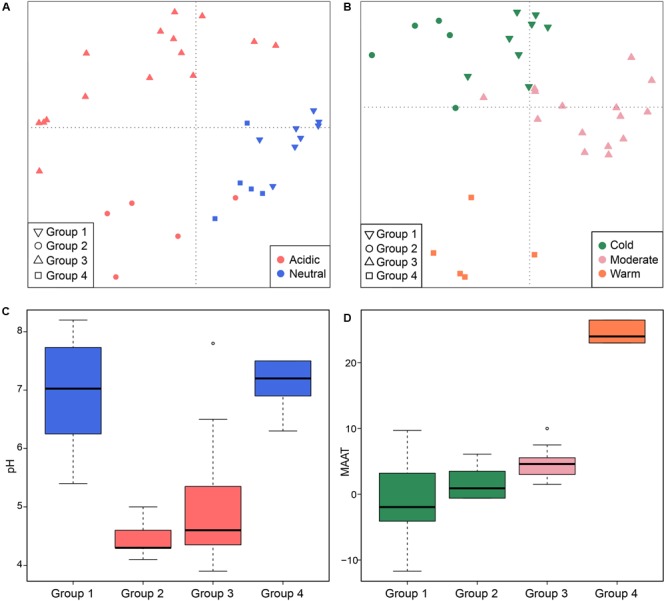
FIGURE 5.
Principal coordinates analysis plot based on a Jaccard distance matrix for 33 non-saline soils and lake sediments. Subplot (A) shows PC1 and PC2 and symbols are colored by pH, and subplot (B) shows PC2 and PC3 and symbols are colored by temperature. The first three components explain 17.1, 11.7, and 10% of the variance. The box plots show the pH (C) and MAAT (mean annual air temperature) (D) of four identified sub-groups. The box color in figure C corresponds to the pH category in (A). The colors of the boxplots show statistical significance based on a pairwise Wilcoxon test (P < 0.05), where the samples with the same color do not significantly differ from each other. Similarly, color in (D) follows the temperature grouping in (B). The sub-groups refer to the hierarchical cluster analysis of community similarities.