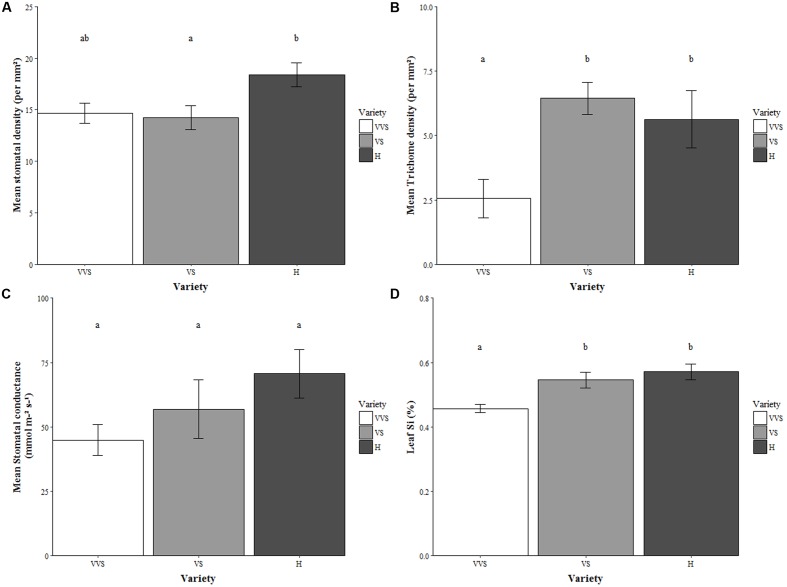
FIGURE 1.
(A) Stomatal density, (B) Trichome density, (C) Stomatal conductance, and (D) Leaf Si concentration. VVS = very very soft, VS = very soft, and H = harsh. Values represent unbagged and undamaged plants. Bars are mean values ± SE. N = 9 for stomatal density, n = 5 stomatal conductance and n = 10 for leaf Si. Letters within bars denote significant differences between treatments (post hoc Tukey p < 0.05).

