
FIGURE 3.
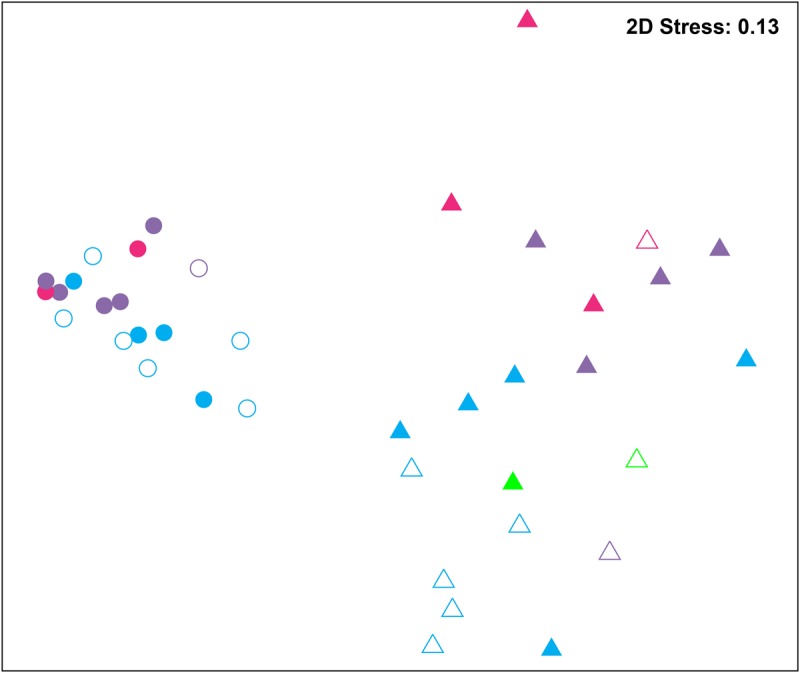
Non-metric multidimensional scaling (NMDS) analysis of all samples based on OTU level. Bray–Curtis similarity metric was used with PRIMER 6. Circle and triangle represent shrimp and water samples, respectively. Blue, purple, and red represent zoea, mysis, and postlarvae stages, respectively. Green: rearing water before larvae were released into pond. Symbols filled and unfilled color indicated healthy and diseased, respectively.