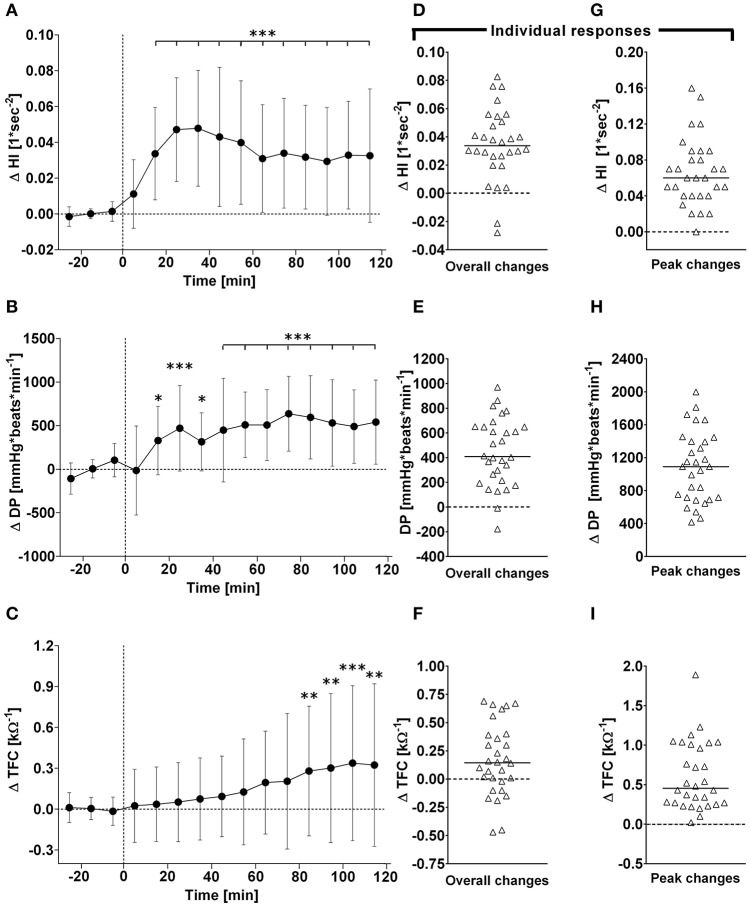
Figure 3.
(A–C): Time course of changes (Δ) from baseline in Heather index (HI), rate pressure double product (DP), and thoracic fluid content (TFC), respectively. Closed circles (•) represent averaged beat-to-beat data over 10 min intervals, which were subtracted from each baseline level and presented as deltas. Data recorded during the 4 min glucose ingestion period were excluded from the analysis, and Time 0 denotes the resumption of continuous cardiovascular measurements after subjects have finished the oral glucose drink. (C–E) represent overall (i.e., averages over 120 min with baseline values subtracted) changes in HI, DP, and TFC relative to baseline. (E–G) represent peak (i.e., derived from the maximum response averaged over a 10 min interval) changes in HI, DP, and TFC relative to baseline. *P < 0.05, **P < 0.01 and ***P < 0.005 represent statistically significant differences over time from baseline values (left). Left values are reported as means ± SD, whilst right data are presented as a scatter dot plot with a median (bold horizontal dashed line).

