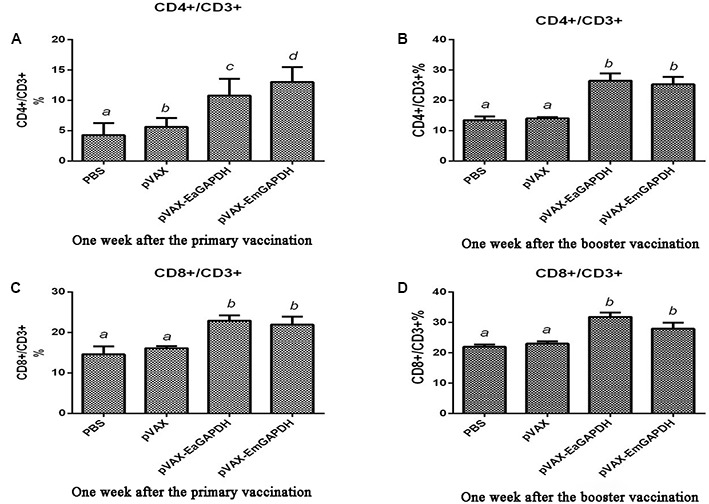
FIGURE 7.

Changes of proportion of CD4+/CD3+ and CD8+/CD3+ T cells in spleens of the chickens vaccinated with pVAX-EaGAPDH and pVAX-EmGAPDH. (A) Proportion of CD4+/CD3+ T cells in spleens of the chickens 1 week after the primary vaccination; (B) proportion of CD4+/CD3+ T cells in spleens of the chickens 1 week after the booster vaccination; (C) proportion of CD8+/CD3+ T cells in spleens of the chickens 1 week after the primary vaccination; (D) proportion of CD8+/CD3+ T cells in spleens of the chickens 1 week after the booster vaccination; significant difference (p < 0.05) between numbers with different letters; non-significant difference (p > 0.05) between numbers with the same letter.
