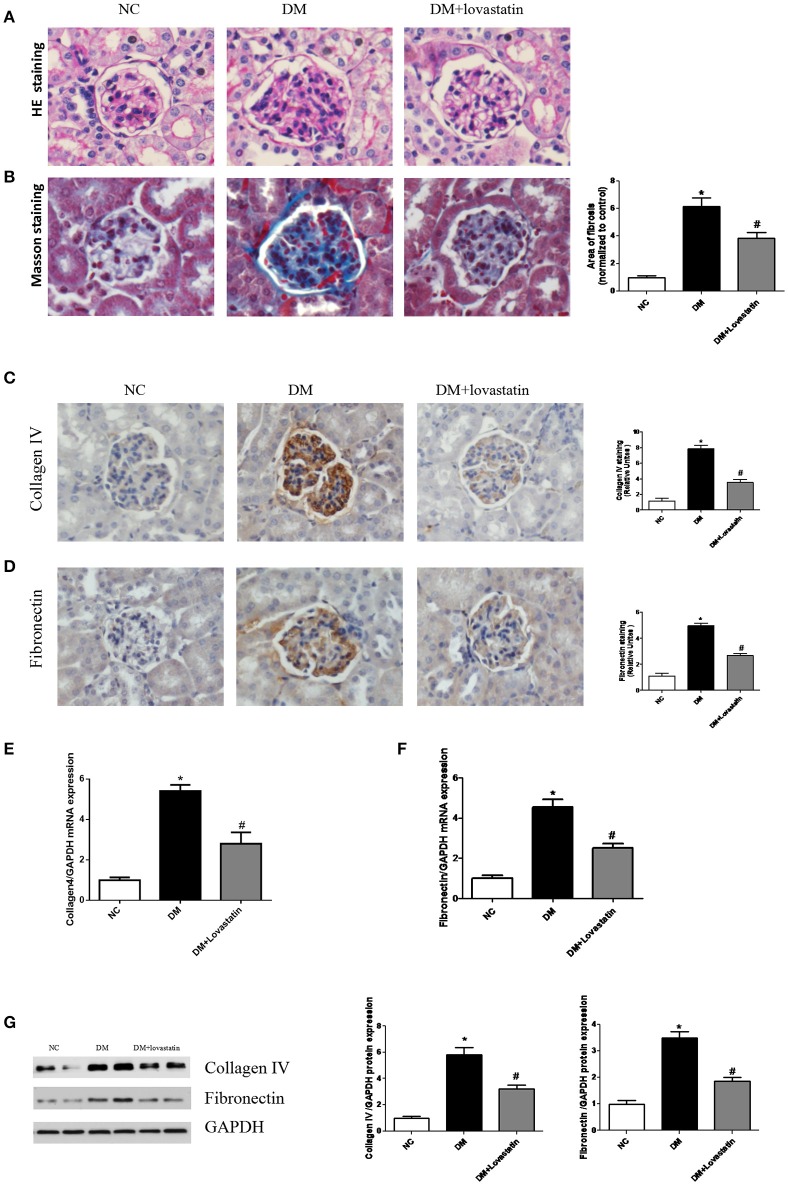
Figure 2.
Pathological analysis of rat kidney tissue. (A) HE staining. (B) Masson's staining. (C,D) Immunostaining for Collagen IV and Fibronectin. (E,F) The mRNA expression levels of Collagen IV and Fibronectin. (G) Western blotting of Collagen IV and Fibronectin proteins in different groups. NC, normal control group; DM, diabetic group; DM +Lovastatin, lovastatin-treated diabetic group. *P < 0.05 between the NC and the DM groups; #P < 0.05 between the DM and the DM + Lovastatin groups.

