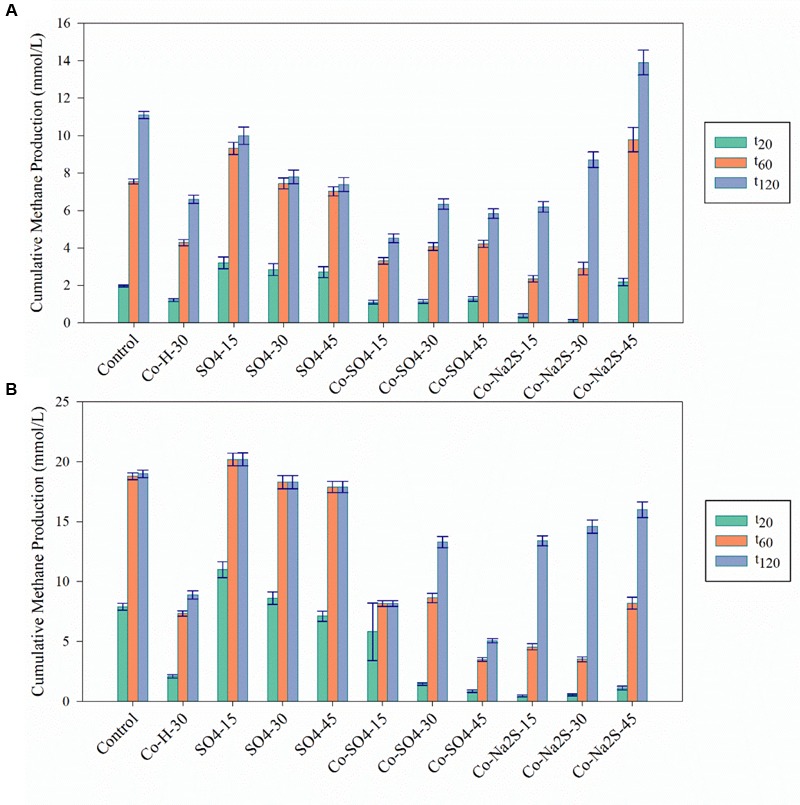
FIGURE 4.

Cumulative methane production values for the Co detoxification assays at the three different time points (t20; t60; t120) in (A) in the presence of H2/CO2 and (B) in the presence of acetate. The black bars indicate the 95% confidence intervals. H stands for High concentration, L for Low and M for Moderate. H/L – high/low metal concentration (mM/mM orders); numbers indicate concentrations of metals and sulfate/sulfide (Supplementary Table S1 for detailed description).
