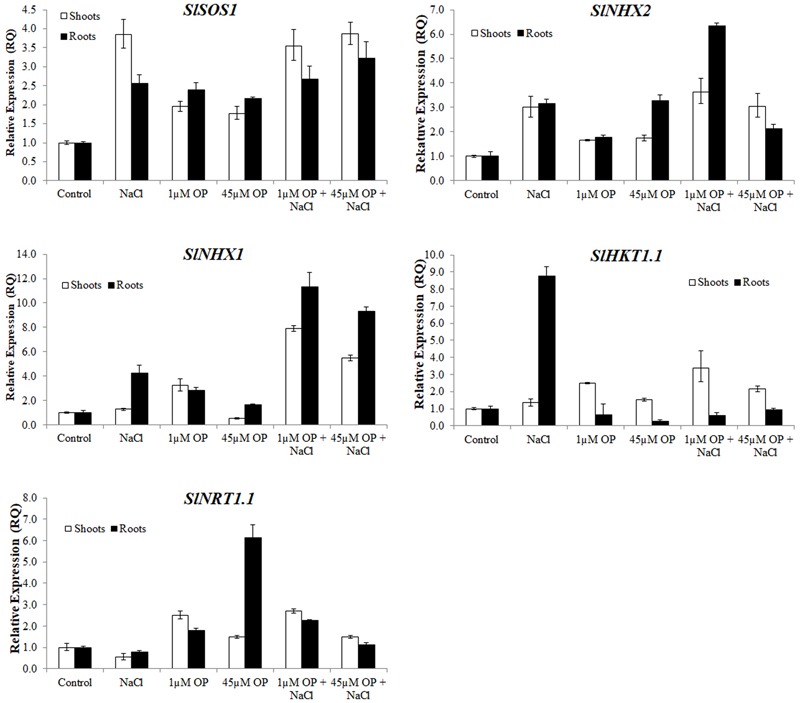
FIGURE 5.

Ion transporter gene expression in plants treated with omeprazole. Plants were grown in a hydroponic solution containing 0, 1, and 45 μM OP, with and without 200 mM NaCl. Samples for qRT-PCR were harvested after 2 weeks of salt treatment (50 DAS, 14 DSS) and harvested for ion analysis. Values indicate average ± SD (n = 3).
