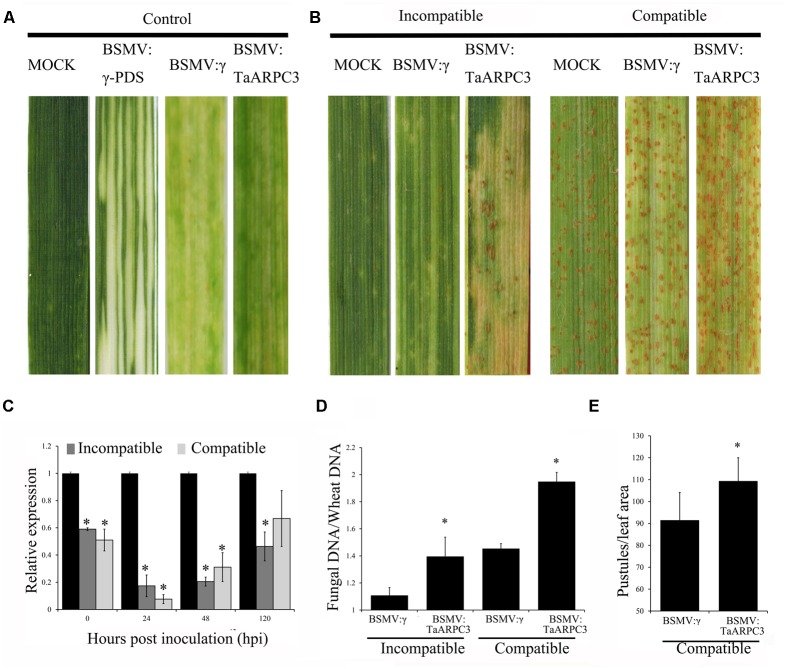
FIGURE 6.
The instantaneous silencing of TaARPC3 by BSMV-VIGS method. (A) Wheat leaves treated with 1× Fes buffer (MOCK) shown no phenotypic changes. Mild chlorotic mosaic symptoms were detected on the plants inoculated with BSMV:γ, BSMV:PDS or BSMV:TaARPC3. (B) Phenotypes of the fourth leaves infected with urediospores of Pst CYR23 (avirulent) or CYR31 (virulent). Representative leaves were photographed at 15 dpi. (C) Relative expression levels of TaARPC3 in knockdown plants challenged with CYR23 or CYR31 at 0, 24, 48, and 120 dpi by qRT-PCR assay. The relative transcript level of TaARPC3 was calculated by the comparative threshold method (2-ΔΔCT). Error bars represent the standard deviations among three independent replicates. Asterisks indicate significant difference (P < 0.05) in relative expression as compared to mock inoculated samples. (D) Fungal biomass analysis assay in TaARPC3-knowdown plants after inoculation CYR23. Asterisks indicate significant difference (P < 0.05) in relative expression as compared to BSMV:inoculated. (E) Quantification of the uredinial density in the TaARPC3-knowdown plants after inoculation CYR31. Asterisks indicate significant difference (P < 0.05) in relative expression as compared to BSMV:inoculated.

