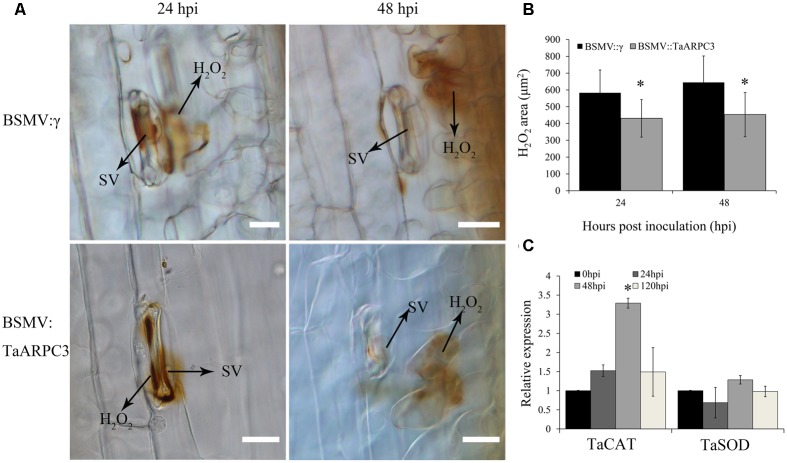
FIGURE 7.
H2O2 accumulation observations of know-down plants that inoculated with incompatibility race CYR23. (A) H2O2 accumulation was measured at infection sites by microscopy. HMC, haustorial mother cell; IH, infection hypha; HR, hypersensitive response; SV, sub-stomatal vesicle. Bar, 20 μm. (B) The area of H2O2 staining by 3,3′-diaminobenzidine (DAB) was measured by DP-BSW software in TaARPC3 knockdown plants at 24 and 48 hpi after inoculation. (C) Relative expression of TaCAT and TaSOD in TaARPC3 knockdown plants. Error bars represent the variations among three independent replicates. Asterisks indicate significant difference (P < 0.05) from BSMV:γ using Student’s t-test.

